I’m pretty sure I’ve seen this request before but I can’t find it. When I was developing APIs in Wappler it was kind of time consuming checking the right data was being returned in each step.
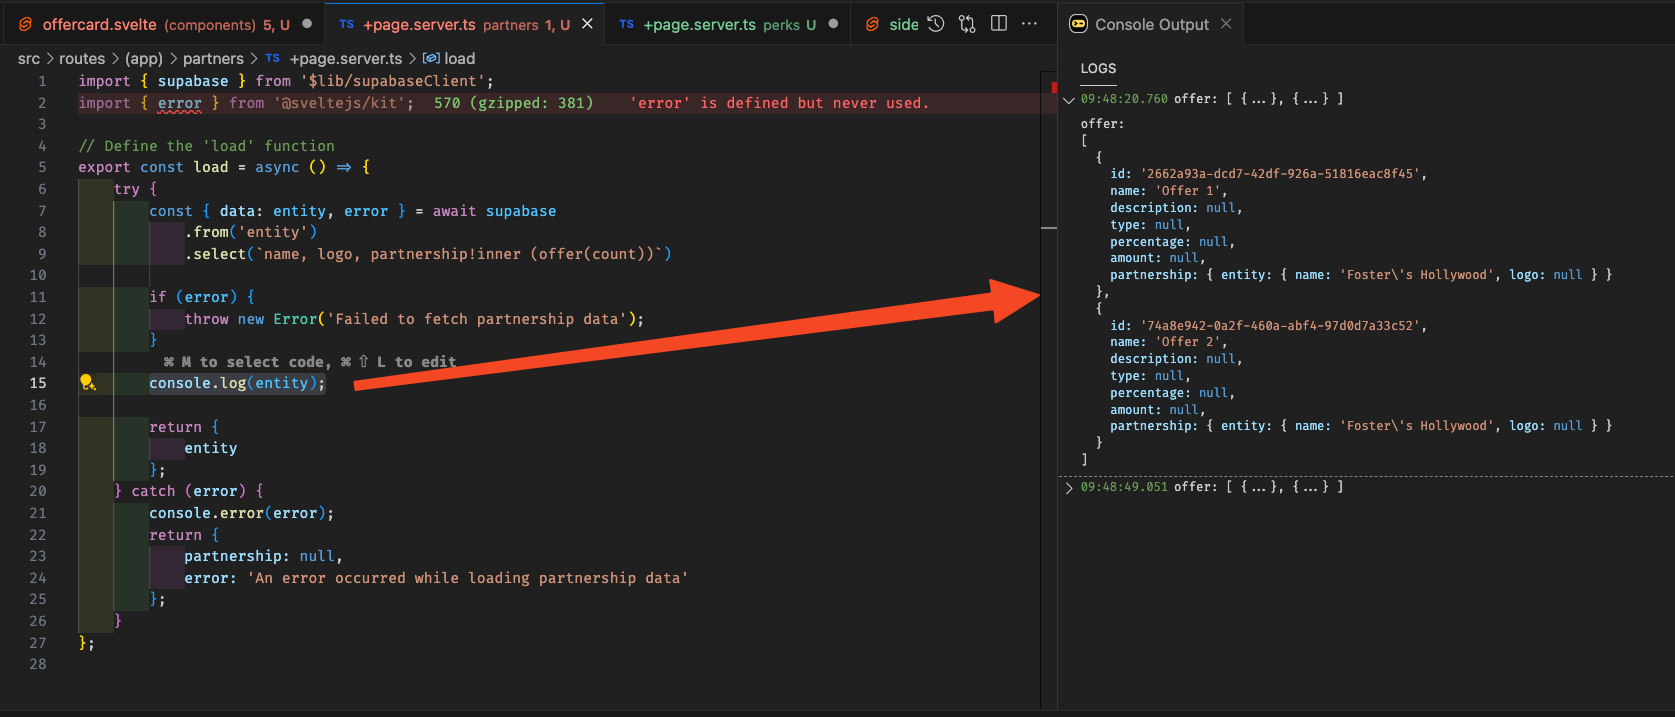
This is how Console ninja for vscode solves this: It outputs to the VScode editor the result of any console.log output.
Very interesting, this could speed up development a LOT. Having the ability to run queries now directly in the server action is already a time saver, adding this will really take it to the next level.
This is kind-of similar to the FR about output-for-debug option (which outputs everything-always), but a step further to show the output in Wappler itself, rather than looking in the browser’s network tab?
@george and @patrick, is this in your roadmap? this function is mandatory for me to continue using Wappler! I spend many hours finding simple problems, this is fundamental in a lowcode tool that presupposes agility and productivity, as I am currently wasting a lot of time solving simple problems and issues! I hope you understand!
Console.log debugging is only used when building custom modules. In normal server connect usage you can achieve similar results by just adding ‘Set Value’ step and outputting the data.
You can actually do that even for custom modules.
So the output data is just available in the dev tools just as the rest of the data.
So no, this request is not on our roadmap as it is already easily achieved otherwise.
But it is important to understand that just using data evaluation through inspection by the browser or the use of "set values" are insufficient for efficient debugging! This has to be very clear, because even with the use of the "set values" feature, they are only displayed in the last flow and of course there are other ways to get around this, such as using sockets or other ways, but they are resources that we must create, precisely because of the lack of any efficient way to debug what is being written. We need tools that make coding easier and not need to create artificial resources to meet basic needs.
Step-by-step debugging and breakpoints are implemented in IDEs such as Visual Studio Code with regular programming languages.
@ everyone The quoted text is not a case of technical impossibility, this is a case of feature request priority ordering, the team finds the engineering effort not worth it, and I understand because I agree it takes a lot of time to do it right
Well we will see what we can do, it will be a technical challenge, but there might be more possibilities in NodeJS for visual debugging of the data and direct execution in Wappler. Might be a good feature for Wappler 7