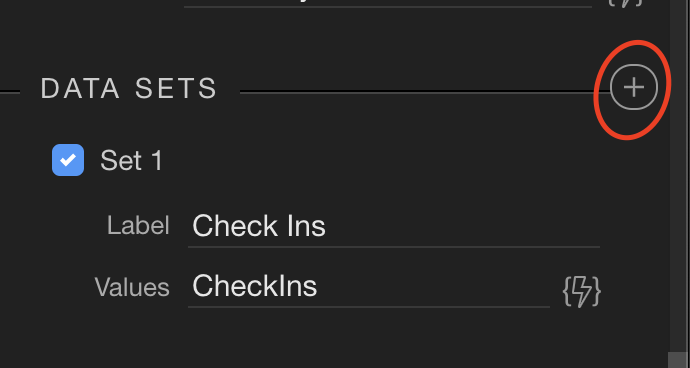
I have a chartt working nicely. It shows all check Ins to our three offices. What I would like to do is have the chart show all three offices on a different line.
How would I divide it up into three different lines?
I have a chartt working nicely. It shows all check Ins to our three offices. What I would like to do is have the chart show all three offices on a different line.
How would I divide it up into three different lines?
Not in front of computer so this is from memory but either 3 different recordsets or same filtered in app connect, perhaps via a data view. You can then define multiple lines (9 max if I recall correctly) by binding different record sets if I recall correctly
YOu can only assign one data source so using three different recordsets won’t work. You can define more datasets but how would I define the values?
Sorry, memory failure. you have to do this via the data query, returning Count() of each office as a separate field. i.e countofoffice1, countofoffice2, countofoffice3 Then you can create multiple data sets based on each field. (hope memory is working a little better)
Oh man, I wouldn’t even know where to start writing a query like that. 
Adding an idea. Maybe try it with a view and use the view to create the graph
I don’t think the query to get what you want will be too bad, I did something similar recently, basically doing what @Hyperbytes suggested. What does your table you are querying from look like? What does your current query look like?
@brad, give me an overview of the necessary fields/ structure and I will see what I can do for you.
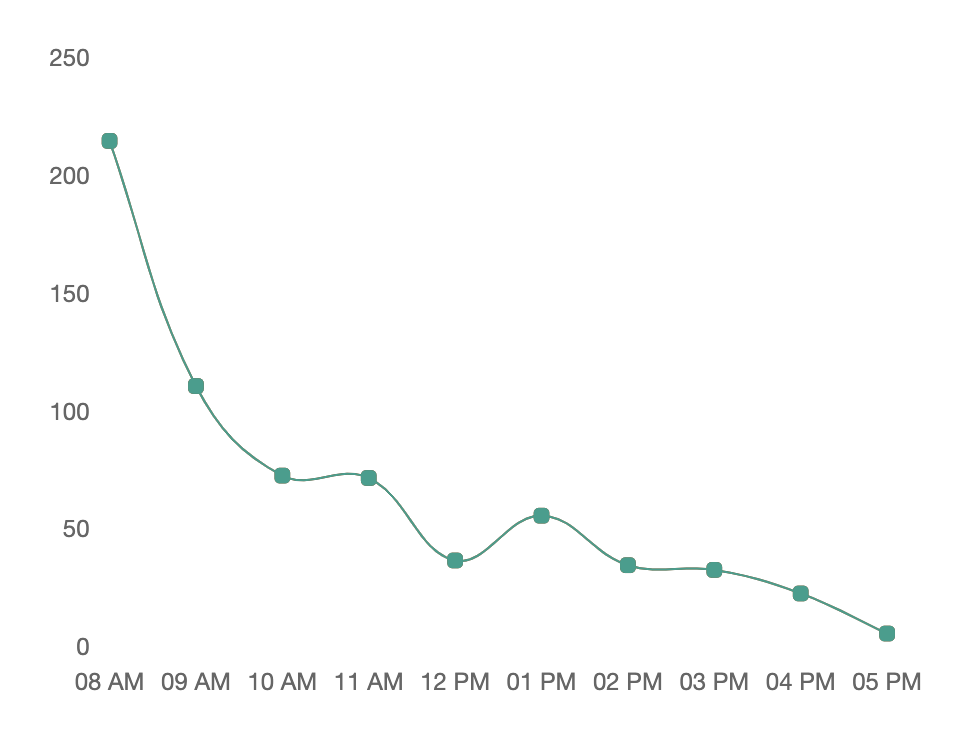
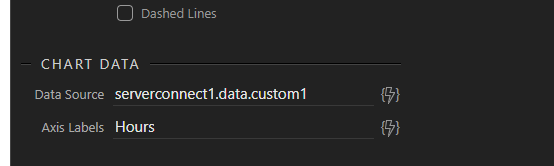
Here is the current SQL Statement and resulting chart …
SELECT track_office AS Office, DATE_FORMAT(track_time,"%I %p") AS Hours, COUNT(track_time) AS CheckIns
FROM t_trackervisits
WHERE track_time > '2019-11-16'
GROUP BY DATE_FORMAT(track_time,"%I %p")
ORDER BY track_time
Any help would be appreciated 
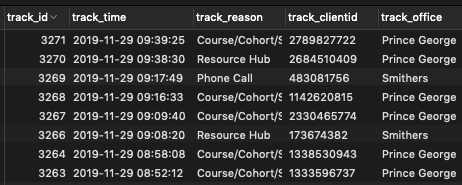
Here is a sample of the data … important fields are track_time and track_office
(posting here as sent over via PM so others can comment)…
I see. The 3 offices you want to show to be charted are values and not column names. In the dynamic chart, you can only plot per column name as data sets. This means you need to have “Virtual”, “Smithers”, and “Prince George” as column names and the values will be the “CheckIns” track_time.
So you will need to use Pivot Table. Are you using MS SQL?
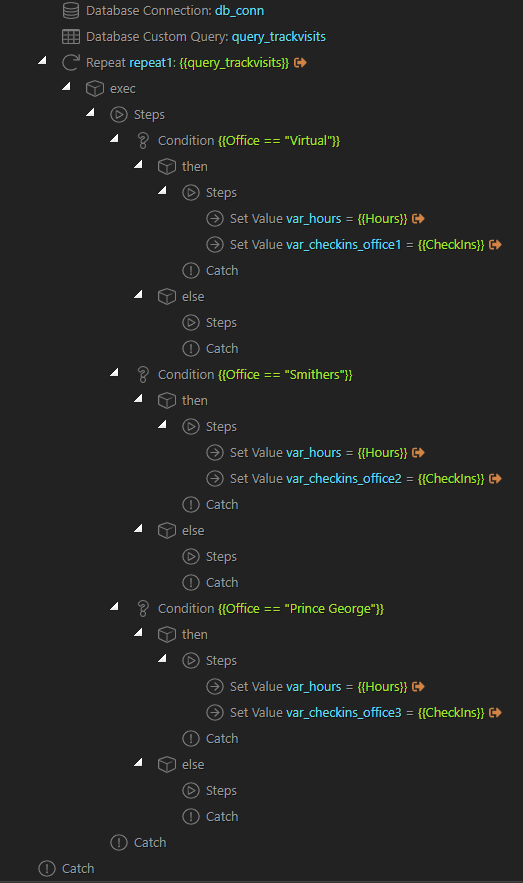
Or you can do what @Hyperbytes suggested. You can create variables in Server Actions that will contain the counts ( i.e countofoffice1, countofoffice2, countofoffice3). The variables will show as columns when returned back to the page.
MySQL
I have an example but for MS SQL. Pivot tables are good if your office names are constant and will not change. If you add a new office then you will need to modify the Pivot Table query. (I think it is not possible to use dynamic pivot table in Wappler as you will have problems creating variables in the custom query).
Since you are using MySQL, then you can try @Hyperbytes’ suggestion.
Hi @brad, if you still need, maybe you can check the following based on my interpretation on @Hyperbytes’ solution:
You’ll have 4 columns: var_hours, var_checkins_office1, var_checkins_office2, var_checkins_office3
The custome query query_trackvisits will contain your own query.
I haven’t tested it, only visualized with Wappler.
I hope this helps.
Thank you very much, I will give this a try! 
OK @brad,my version
I have just called your offices Office1, Office2 and Office3 , you will have to change the initial view accordingly in the lines like this: t_trackervisits.track_office = ‘Office1’ etc
Firstly I created a database view like this called “officedata” which sums each office total (should be able to copy and paste this;
(select count(`t_trackervisits`.`track_time`) AS `Office1`,0 AS `Office2`,0 AS `Office3`,
date_format(`t_trackervisits`.`track_time`,'%I %p') AS `Hours`,
count(`t_trackervisits`.`track_time`) AS `CheckIns`
from `t_trackervisits`
where `t_trackervisits`.`track_time` > '2019-11-16'
and `t_trackervisits`.`track_office` = 'Office1'
group by date_format(`t_trackervisits`.`track_time`,'%I %p'),`t_trackervisits`.`track_office`)
union
(select 0 AS `Office1`,count(`t_trackervisits`.`track_time`) AS `Office2`,0 AS `Office3`,
date_format(`t_trackervisits`.`track_time`,'%I %p') AS `Hours`,
count(`t_trackervisits`.`track_time`) AS `CheckIns` from `t_trackervisits`
where `t_trackervisits`.`track_time` > '2019-11-16'
and `t_trackervisits`.`track_office` = 'Office2'
group by date_format(`t_trackervisits`.`track_time`,'%I %p'),`t_trackervisits`.`track_office`)
union
(select 0 AS `Office1`,0 AS `Office2`,count(`t_trackervisits`.`track_time`) AS `Office3`,
date_format(`t_trackervisits`.`track_time`,'%I %p') AS `Hours`,
count(`t_trackervisits`.`track_time`) AS `CheckIns` from `t_trackervisits`
where `t_trackervisits`.`track_time` > '2019-11-16'
and `t_trackervisits`.`track_office` = 'Office3'
group by date_format(`t_trackervisits`.`track_time`,'%I %p'),`t_trackervisits`.`track_office`)
Then create a server action with a custom query to process that view
select
sum(Office1) as Office1,
sum(Office2)  as office2,
sum(Office3) as Office3,
Hours
from officedata group by Hours
Then you can create a server connection to this in app connect and use it as a data source for the chart
Then 3 data Sets
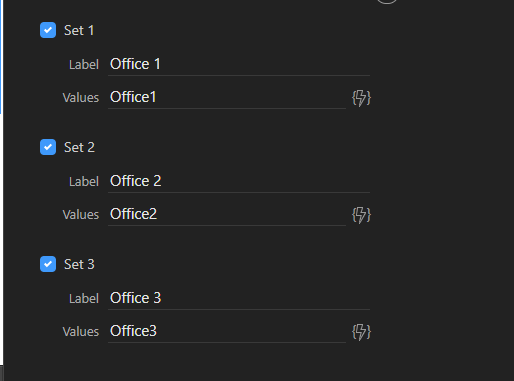
Should give you your 3 data sets
Any problems, come back to me (Sorry, limited data for example)
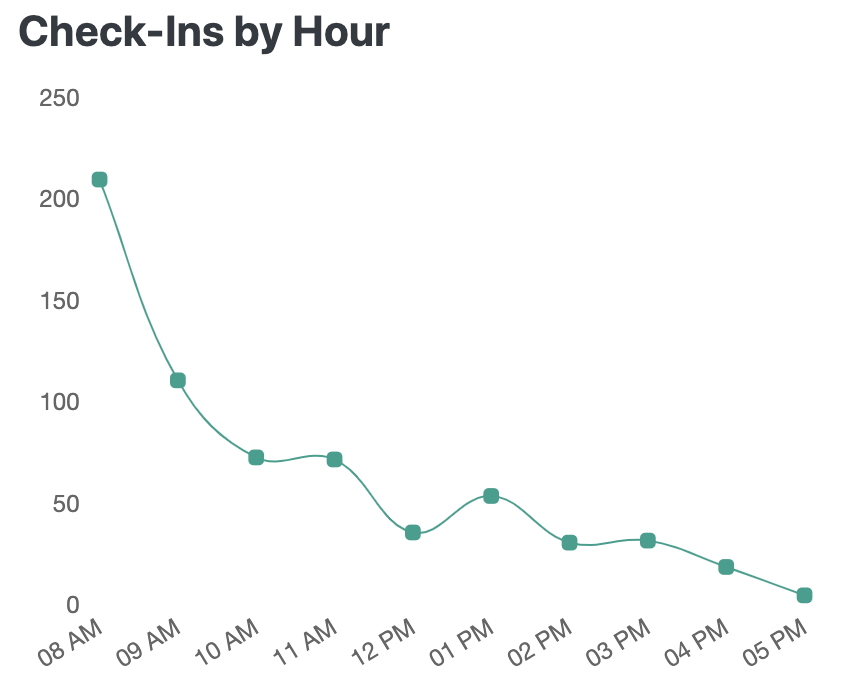
Wow, Brian. I am currently out of town for our staff Xmas party tomorrow but I will try that out. Reading it over it makes sense and the result is exactly what I need
As i had the time, thought i would tidy things up, just one custom query needed, no view required. Just change the office names and copy/paste into a custom query
Have a great christmas party!
select sum(Office1) as Office1,sum(Office2)  as office2,sum(Office3) as Office3,Hours from
((select
count(`t_trackervisits`.`track_time`) AS `Office1`,
0 AS `Office2`,
0 AS `Office3`,
date_format(`t_trackervisits`.`track_time`,'%I %p') AS `Hours`,
count(`t_trackervisits`.`track_time`) AS `CheckIns`
from `t_trackervisits`
where `t_trackervisits`.`track_time` > '2019-11-16'
and `t_trackervisits`.`track_office` = 'Office1'
group by date_format(`t_trackervisits`.`track_time`,'%I %p'),`t_trackervisits`.`track_office`)

union
 (select
0 AS `Office1`,
count(`t_trackervisits`.`track_time`) AS `Office2`,
0 AS `Office3`,date_format(`t_trackervisits`.`track_time`,'%I %p') AS `Hours`,
count(`t_trackervisits`.`track_time`) AS `CheckIns`
from `t_trackervisits`
where `t_trackervisits`.`track_time` > '2019-11-16'
and `t_trackervisits`.`track_office` = 'Office2'
group by date_format(`t_trackervisits`.`track_time`,'%I %p'),`t_trackervisits`.`track_office`)

union
(select 0 AS `Office1`,
0 AS `Office2`,
count(`t_trackervisits`.`track_time`) AS `Office3`,
date_format(`t_trackervisits`.`track_time`,'%I %p') AS `Hours`,
count(`t_trackervisits`.`track_time`) AS `CheckIns`
from `t_trackervisits`
where `t_trackervisits`.`track_time` > '2019-11-16'
and `t_trackervisits`.`track_office` = 'Office3'
group by date_format(`t_trackervisits`.`track_time`,'%I %p'),`t_trackervisits`.`track_office`))
as mydata
group by Hours
Both great solutions Brian.
Advantage of having a separate Db view is that in Wappler you can use the visual query builder to select it and also views are more optimized by the database once defined.
Agreed but I was concerned that the date was fixed within the view where the custom query solution allows the date to be parameterised if needed.
could become something like:
where t_trackervisits.track_time > $_GET.tracktime