Ok we have a small update for you guys.
Please unzip and replace the existing js file with this one:
dmxCharts.zip (2.4 KB)
Then in order to display the value formatted in the tooltip, use it like:
dataset-1:tooltip="$value.formatCurrency('NOK', '.', ',', 2)"
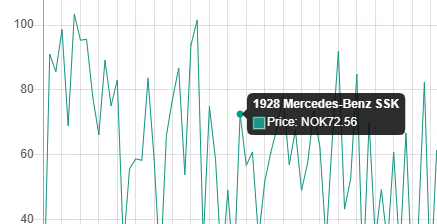
If you want to show the Total Earned (i.e. the label text) as well do it like:
dataset-1:tooltip="$label + ': ' + $value.formatCurrency('NOK', '.', ',', 2)"
Not sure if that will be included in today’s update UI, but it’s easy enough to manually add it as in the example above.