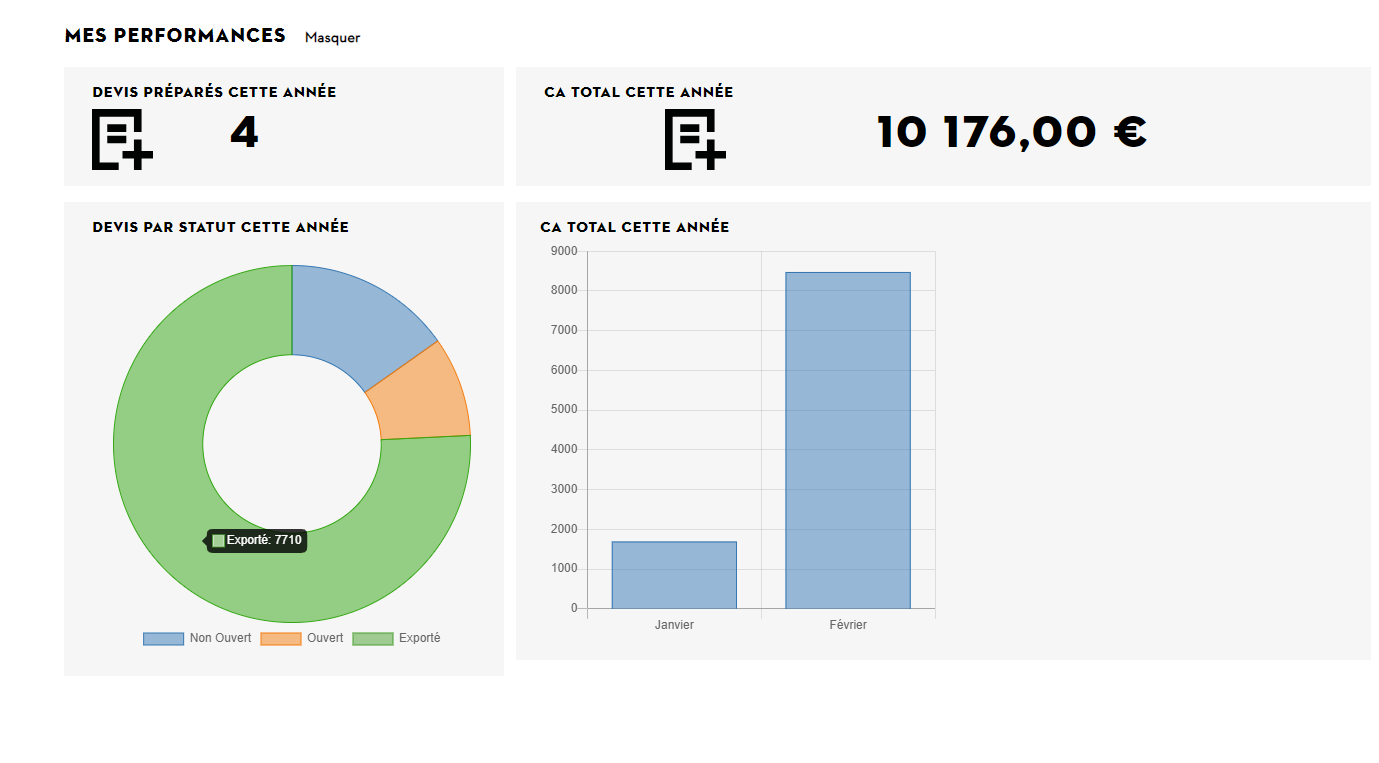
Currently it only appears on hover, very practical, and how to add the € symbol behind the value and two decimal places to the number
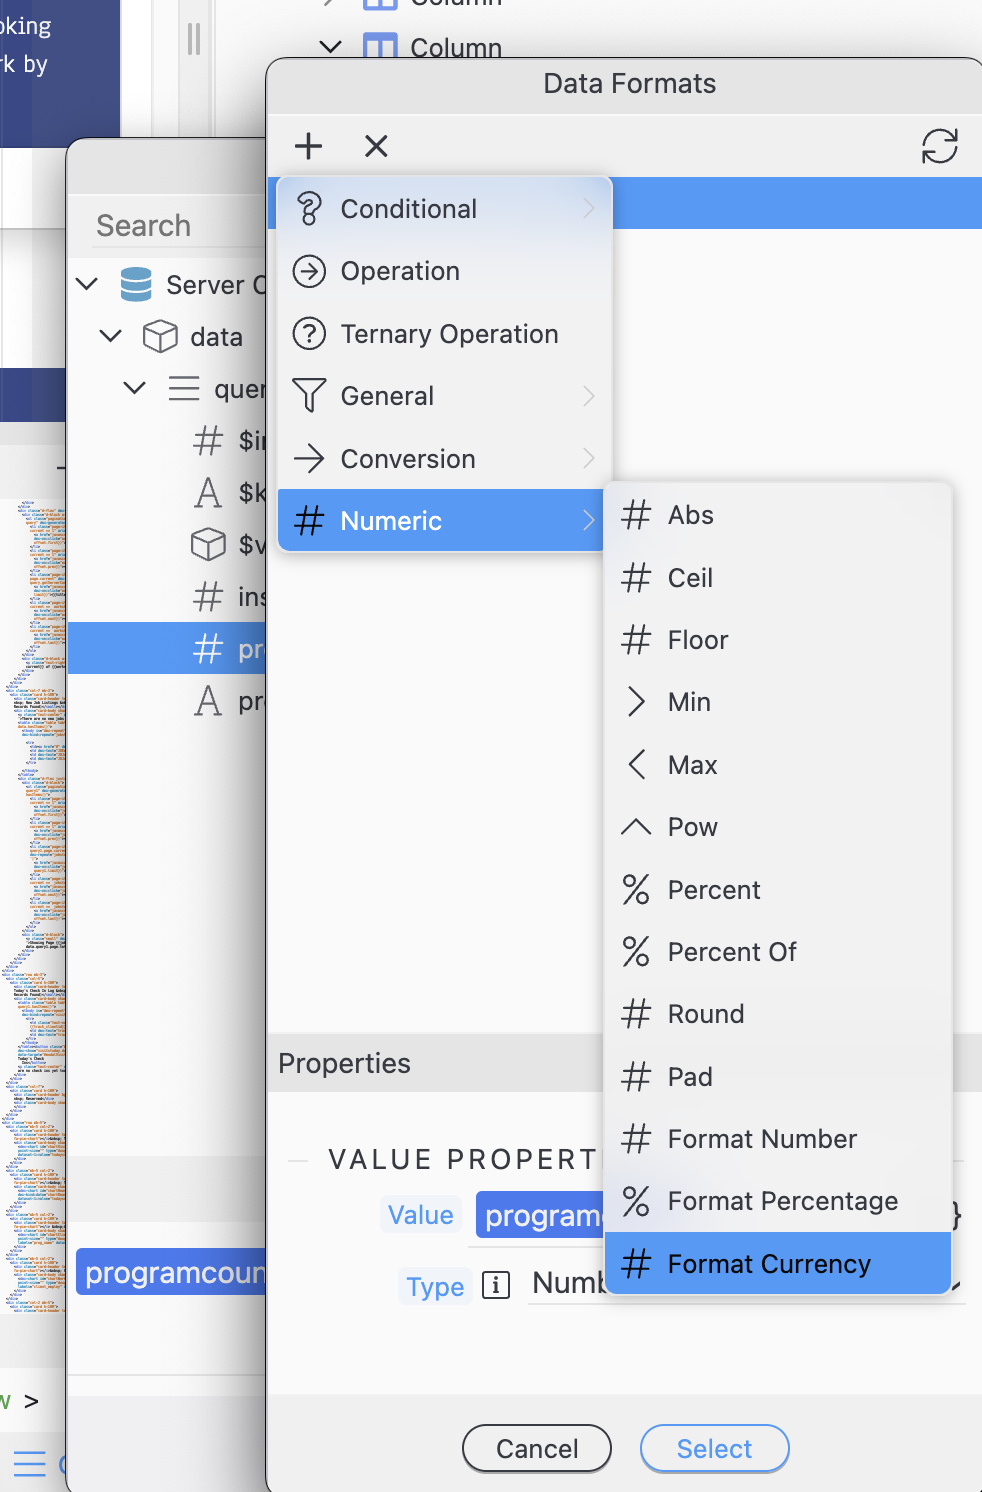
On your AXIS Labels binding you should be able to format currency. May have to convert to number first.
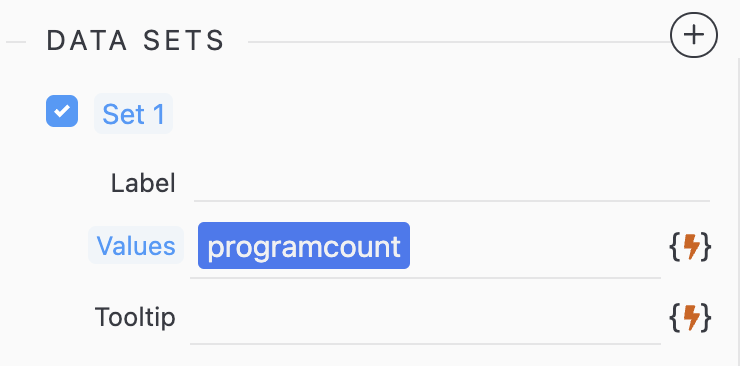
EDIT: Actually you need to apply the formatting to the data set vale.
1 Like
This does not work, it considers that it is text and suddenly the graph disappears, @teodor, is it possible to leave the values displayed permanently and is it possible to put text behind the graph value, for example the currency symbol
THANKS