I am displaying values for each day of the week in a chart. On the x-axis I would like to see mon, tue … sun for 7 Y-axis values I have from a mySQL database. How to do this in a simple way? Can I define a Set value array for this, and how to do this?
20 views but no answer… this must be complex or is it too obvious?
Maybe I should ask the question in a different way: how to create a constant simple array of VARCHAR(5) with Set Value and use it as x-axis in charts? Is there any example available?
You can add label-x="dynamic_value" in the code for custom labels.
Hi Teodor. Tx for your reply. I am new here and I am still missing some syntax on the way to do this. I found this reference on dynamic x-axis values on youtube:

But the result is as following:
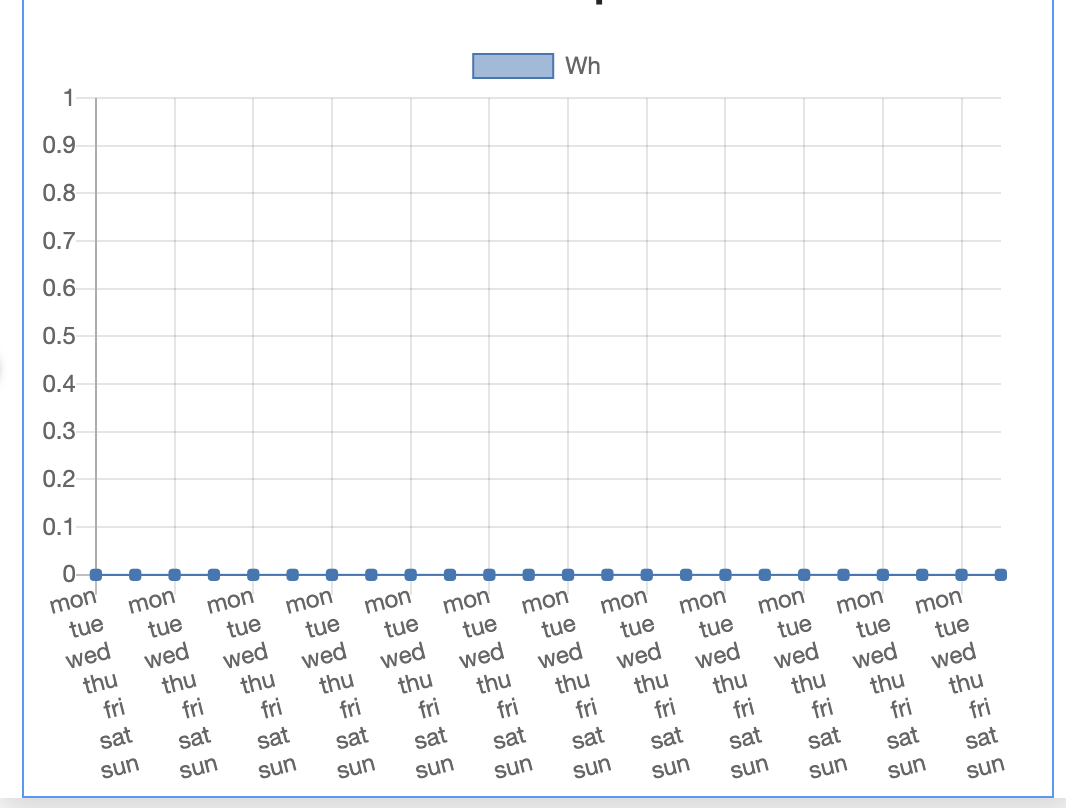
Can you give an example on how to create a static array in Wappler to use in Charts as x-axis? tx
You have to make sure the mySQL query also returns the label, recordsset should look like:
[{
  "label": "mon",
  "value": 12
}, {
  "label": "tue",
  "value": 19
}, {
  "label": "wed",
  "value": 3
}, {
  "label": "thu",
  "value": 5
}, {
  "label": "fri",
  "value": 2
}, {
  "label": "sat",
  "value": 3
}, {
  "label": "sun",
  "value": 1
}]
You set that recordset as a Data Source for the charts, then Label X you select the label property and under Data Sets Values you select the value property.
<dmx-chart id="chart1" dmx-bind:data="'serverconnect1.data.recordset'" label-x="'label'" dataset-1:label="My Data" dataset-1:value="'value'"></dmx-chart>
Hi Patrick,
Tx for the feedback. So this solution is based on mysql connectivity.
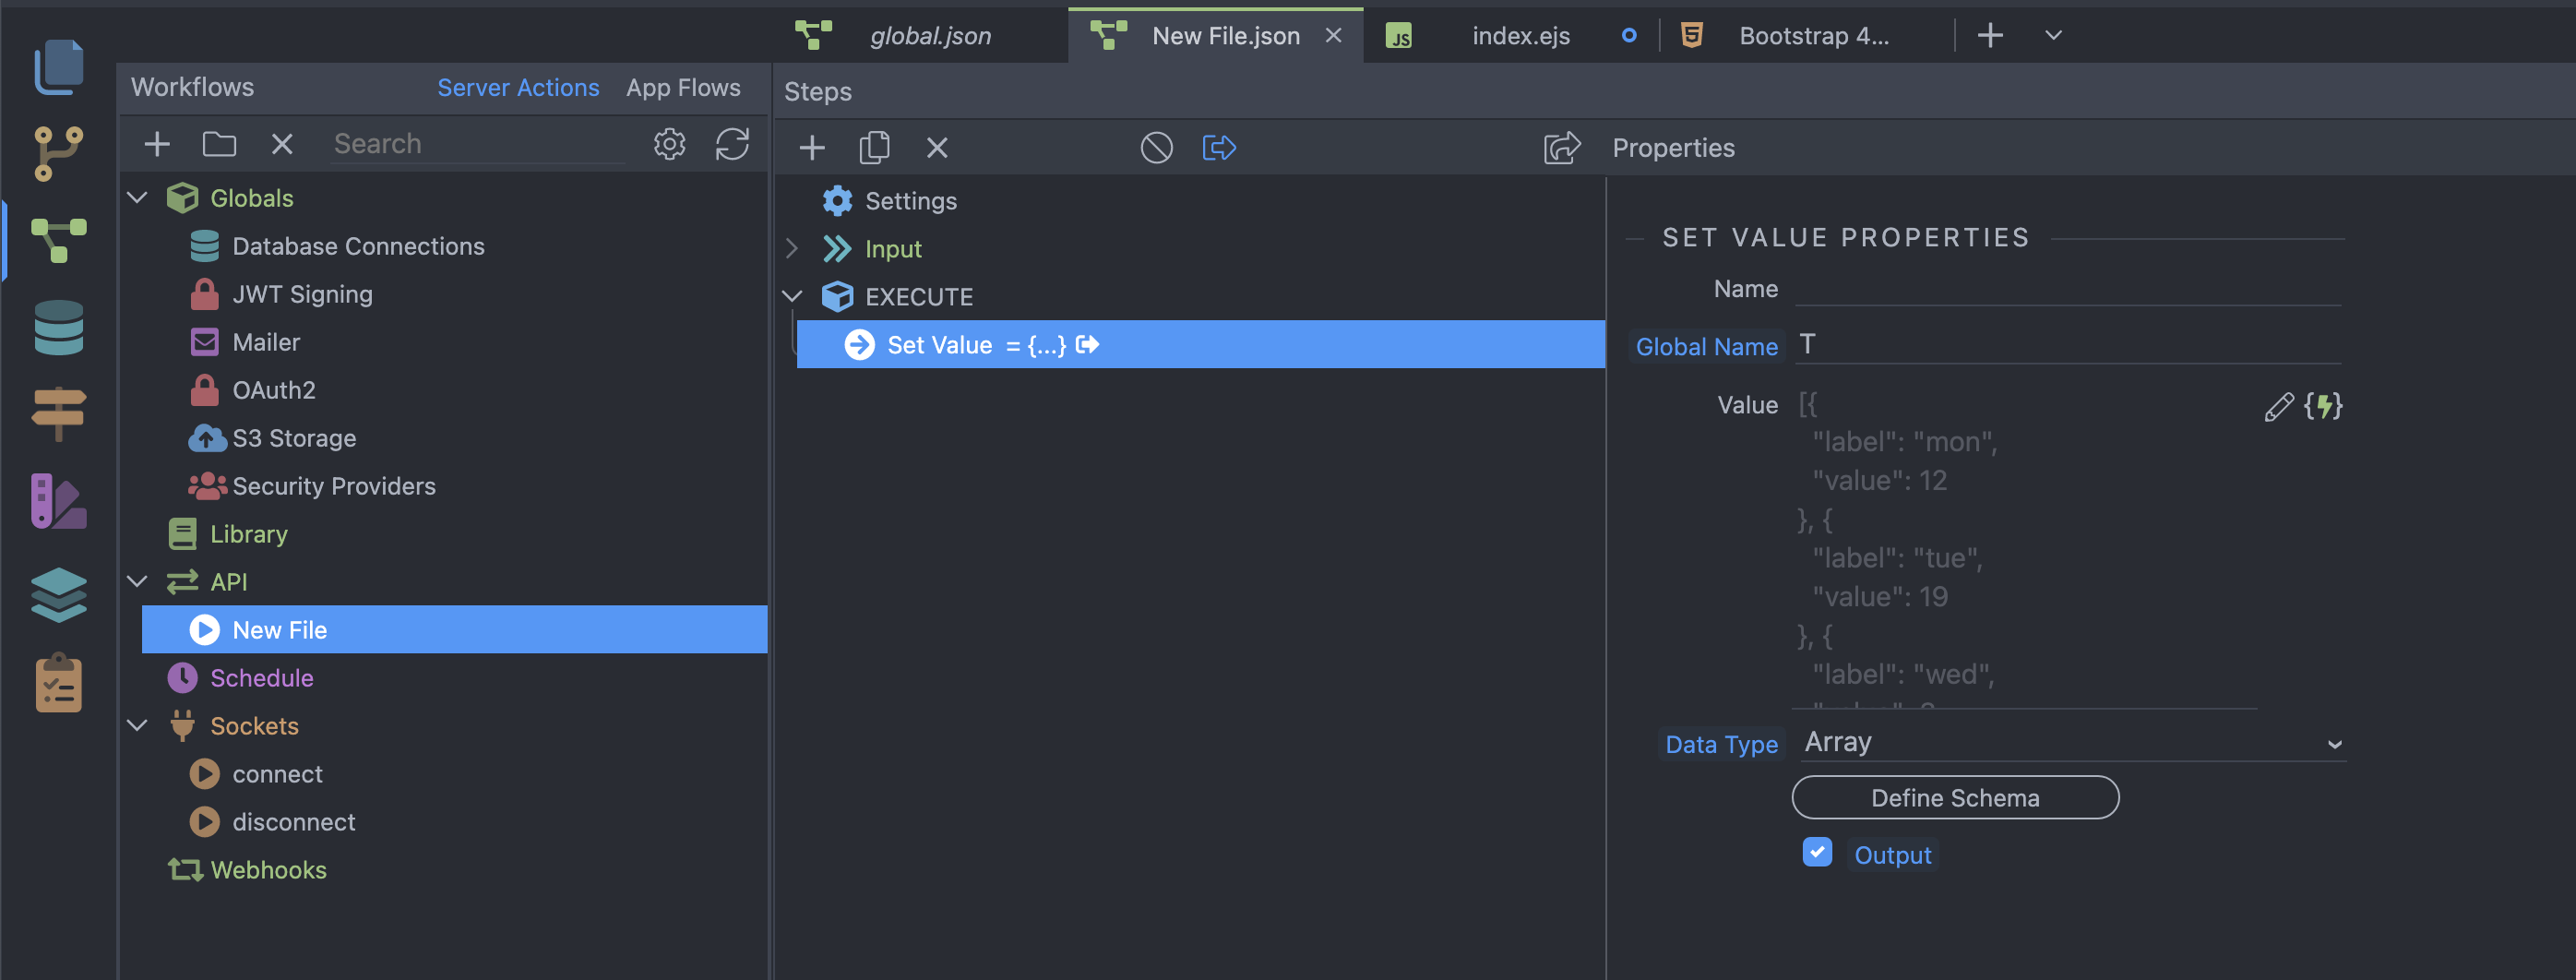
Would it be possible to define a local variable ‘T’ as an array to hold similar JSON data as you mentioned?
In that case I would just create a couple of local arrays as resource to display data in a chart (not using mysql).
How to do this? Any example?