Hi there,
I want to present data in Graph by showing how many items exist from each category.
For example, there are 5 coffee type, 10 alcohol type, 3 energy drink type.
Data is saved in a database and each product belongs to a category. I want to display how many products of each category. Tried with repeat etc but with no success.
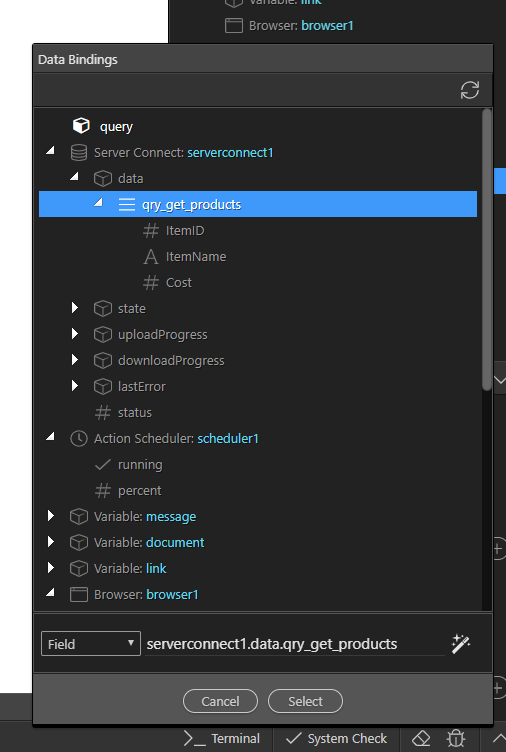
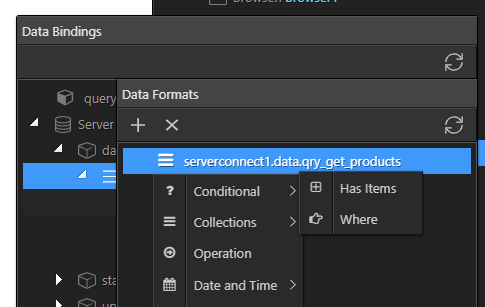
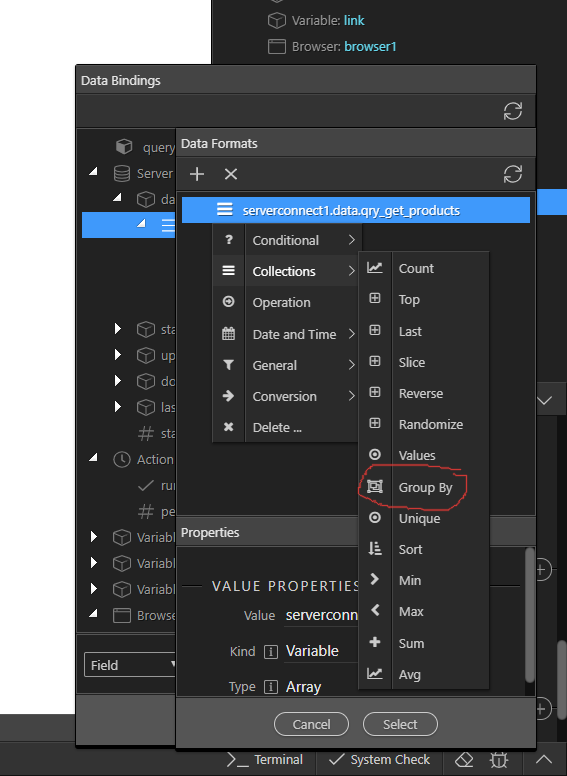
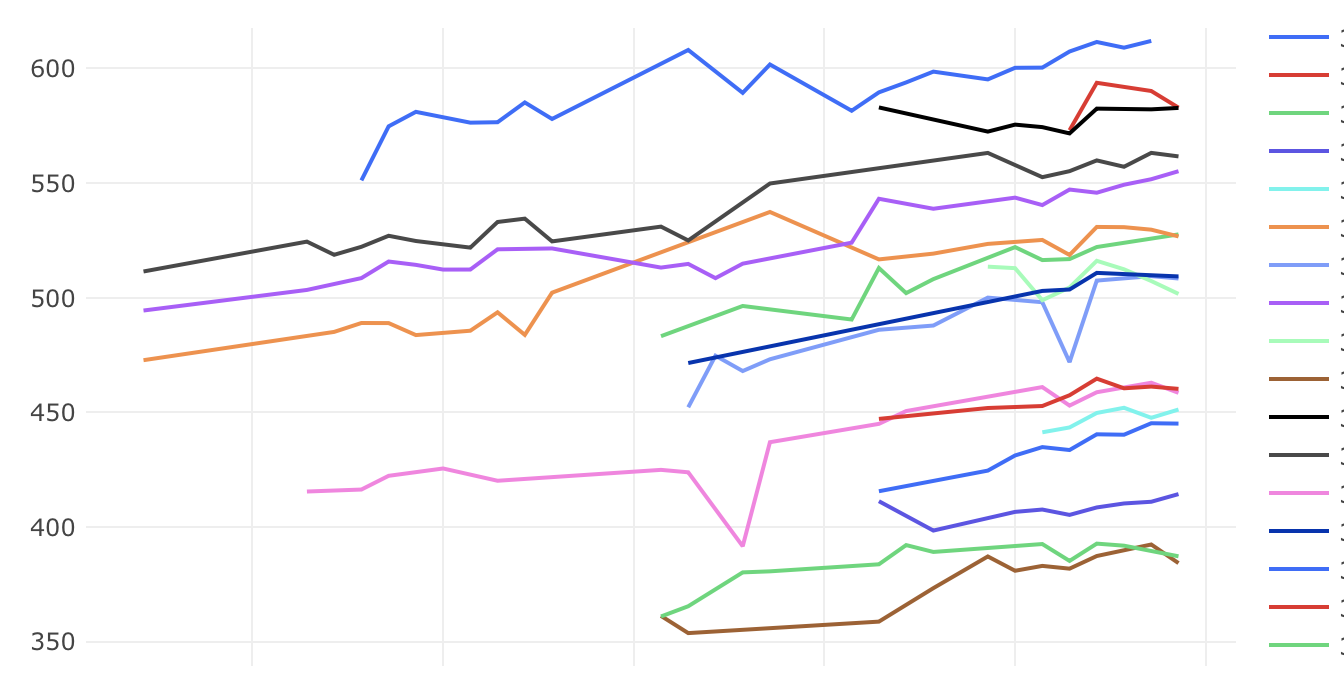
Hi all, I am trying to create a line graph as per the image attached. In the graph I need to group by one of the columns in each row of data. My SQL query works fine in Wappler and provides the correct result but the line graph just plots all my data together. I can’t seem to get the data to group so as to display multiple lines. I have tried to use the group by formatter as mentioned by Hyperbytes, but this returns a graph with NaN values. Anyone any ideas, am I just making a mistake somewhere?
Thanks for the reply. It really needs to be dynamically generated to be honest. Depending on which user is logged in there could be a different number of lines required. Is this a limitation of the line graph do you know?
Certainly the component has limitation but without more info I can’t really comment further. I suspect the answer lies in generating custom data-sets via the query rather than customising the component to the data but on the basis of a picture of a chart it’s hard to be specific on anything