Hello, I have used Wappler charts and it i working great!
There are a couple of options available, but not much in the way of formatting, style or classes.
How can I best change the following:
- Axis text color
- Change the background
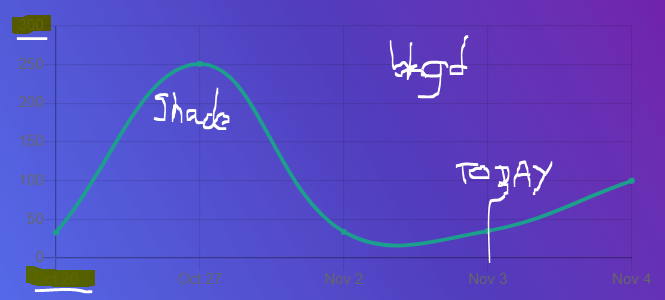
- Add a shade below the line (that's changing type to Area...)
- Change line/dot color
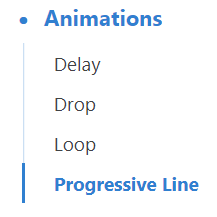
- Choose the animation type (see pic)
- Add a vertical line on Today.
Would it be by adding a class to the chart ?
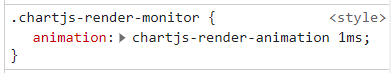
Or redefining the class "chartjs-render-monitor"?
Thank you for any idea!