
Hi
I am adding some charts to my dashboard. I have a simple chart showing sales for the last 6 months.
This is my sql + output:
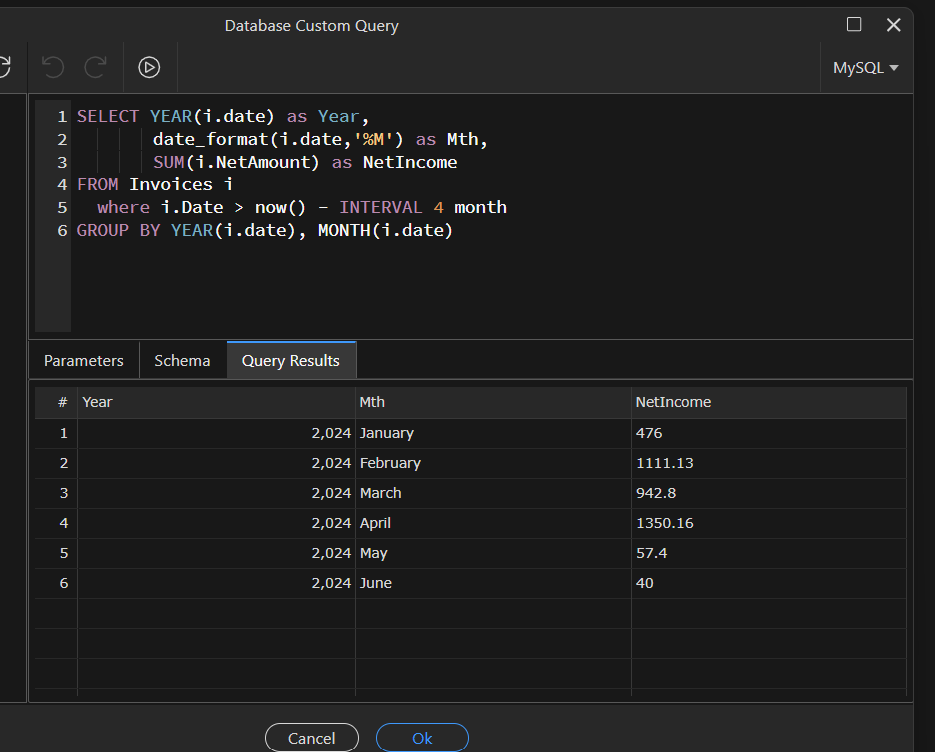
here is my chart code:
<dmx-chart id="chart2" point-size="" type="horizontalBar" multicolor="true" dmx-bind:data="SC_Sales6Months.data.query" label-y="SC_Sales6Months.data.query.Sales" dataset-1:value="NetIncome" responsive="true" label-x="SC_Sales6Months.data.query.Mth"></dmx-chart>
and here is the chart results, you see no month (mth) names, just value1 value2 etc
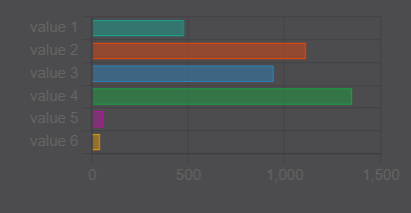
cant work out what I am doing wrong, i did have months showing (once), then i added truncate on it, and it changed to the value1,2 etc, so i removed truncate, now it wont go back to the month names.
thanks
 just not called Sales, thanks
 so huge thanks for that, but still suggests there is a bug in wappler as using the wappler tool to set this up is entering the wrong details into the code and for us “non coders” using low code platforms we kinda hope things work