Hi guys - so I’ve been using Wappler for just under a week now, and I have to admit I’ve fallen in love.
Jumping from Bubble has been a big learning curve, however, I’ve devoted around 50 hours this week on learning Wappler and I finally feel like I’m getting somewhere (moving my app over from Bubble). I’ve got experience in BS and front-end dev so maybe the learning curve hasn’t been as big as might for some, however, I love the flexibility of going and delving into the code if need be - so I feel right at home!
Just one question, what do people find is the best method of debugging generally. In Bubble, naturally, everything is debugged as you add it, and you get an error straight off if something isn’t going to work or join up. E.g. I have a form to insert. It’s not inserting into DB. Where would I find out the field that is causing the issues or what is going wrong - can this be done in Chome?
Many thanks for your help and suggestions and @George and team, keep up the fantastic work!
First, I look to see if there are any errors in Wappler itself. Errors can come from a variety of sources, but that is my first step.
Second, I open the page in Chrome as you mentioned and open the developer tools to see if there are any errors or issues. In addition to errors, I look at the load times as well.
Third, I open the page up in Safari and Firefox and open their developer tools to ensure cross-browser compatibility.
Note: I did not mention Internet Explorer or Edge or whatever it is called. I don’t care about that browser, LOL.
As wappler produces standard code then your biggest friend is the developers console inn your browser which will highlight any errors in JavaScript etc
Also in the event of server errors, normally manifesting as 500 errors then following then is essential to enable error reporting which in most cases will indicate exactly what the error is (see below post)
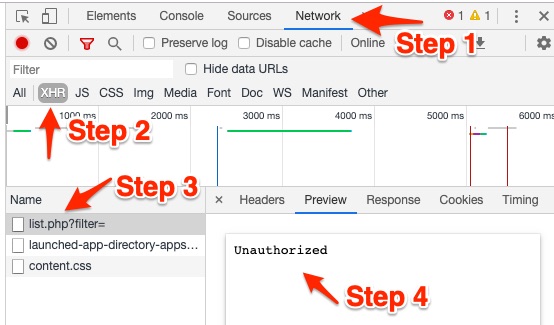
To Illustrate in Chrome, after opening up the Developer Tools:
Step 1: Click on Network
Step 2: Click on XHR
Step 3: Click on the query you are testing
Step 4: Click on Preview to see the results
In the example above, the Preview shows Unauthorized, which tells me that I am not logged in, so the Security Restrict is preventing me from seeing the results of the query.
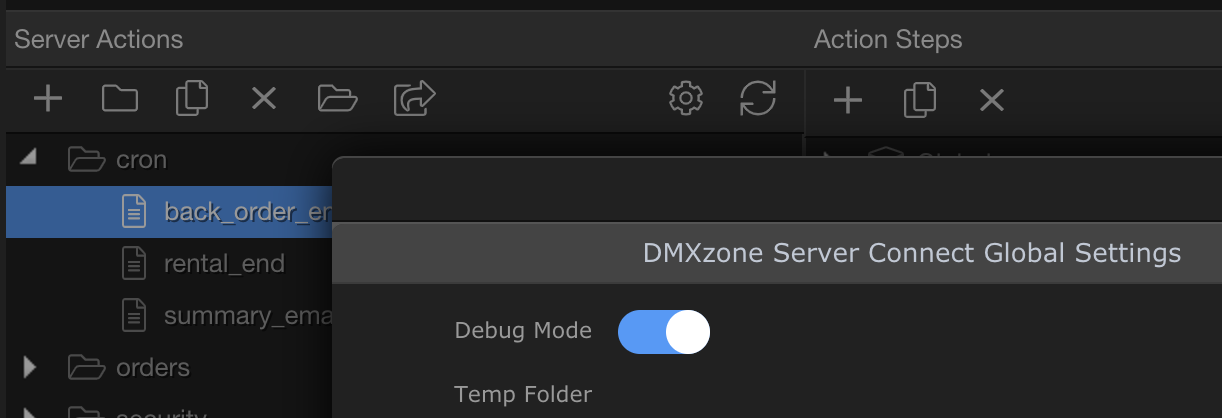
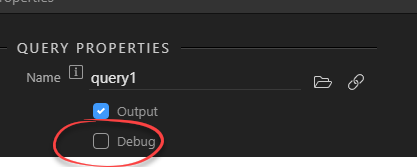
For debugging queries, you can use the ‘debug’ option in server connect:
… then run the query from within server query. (Be careful not to leave this option checked or your queries won’t work.)
If you set up access to the query log in MySQL for example, then you will see exactly what queries are executed. I find this the most useful method to debug queries.
I rarely use the debug option but have noticed some limitations. If your setup doesn’t allow for viewing the actual queries, it’s probably a useful option in some cases.
Query Builder makes it easy to create quite complicated queries - it seems a pity to have to avoid using it because of the limited built-in debugging features. I wouldn’t have thought using custom queries would help a great deal with debugging - but I suppose the query might be clearer to you if you’ve written it from scratch.