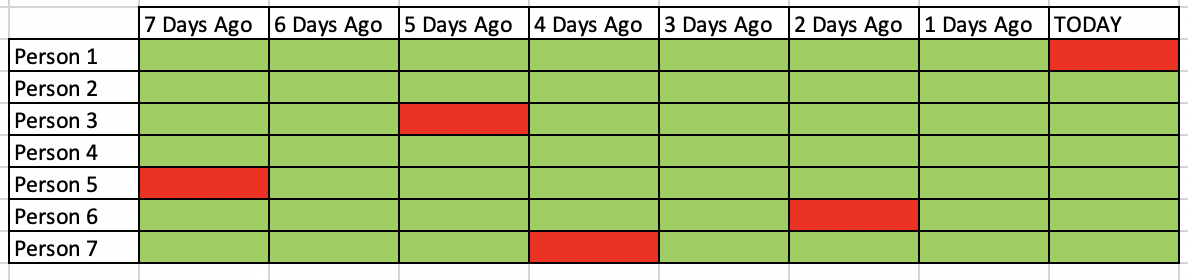
Not really a Wappler specific topic, but thought I’d ask the question and see if anyone has any ideas. I am trying to visualise some data and looking for some advice. Essentially I want to find a simple way of visualising the presence or absence of data for each person over the last 7 days. My initial thoughts are to create queries to pull this data from the database and then create some sort of a php table where a conditional in each cell looks for the presence of data for a certain person on a certain day. Does anyone have any ideas on a nice simple way to implement this.
Just my thoughts on this:
If the column headers are static, that is, you have columns with the names as in the picture, then it is just a matter of creating a query to fill them specifically. And then do what @ben suggested.
If your “days column” are dynamic, then I can see 2 options:
A. If it comes from a row where you put it as the column headers then you need to create a PIVOT table. This is directly via SQL.
B. From Wappler side, then you will need to create repeat-columns inside a repeat-row.
Below is a representation:
That is, A = repeat-row and B = repeat-columns (in that direction).
Then do the “color” part in the page via dynamic attributes just as what @ben suggested.
Thanks @zitroware and @ben, I have managed to create the table above using views and lots of joins. The cells where my values are red are returned as null.
When I try to create a bootstrap table to display this table. The bootstrap table creates the right number of rows for my data but does not display the data.
When I run the query in my server action, it does return the table. Do either of you know why the table might not be showing any values from the query, could be be as a result of null values in cells?
Hi @whlrb, it should not be an issue. I think the issue with null values in a table comes up when you are trying to sort the column that contains a null value (read it somewhere here in the forum).
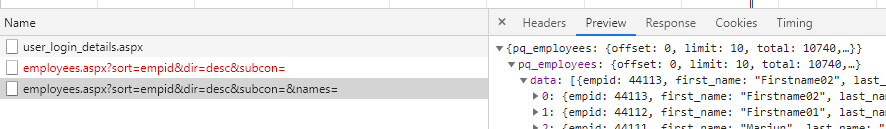
Maybe you can try open in browser to see the values…or you see Preview via Developer Tools in chrome. There, you should be able to see the results returned by your query that is passed to the browser.
Thanks Zitro, I just figured out what the problem was. My column names had spaces in them, and this was messing with the bootstrap table generator I think. Once I removed the spaces from the column names everything worked fine.
About the spaces in column names, if you are referring to column names in the database, that is not the practice. Do not use spaces there.
I remember I have encountered the same issue before but using PIVOT tables. I have asked for a fix since it is a PIVOT table and not by design, Wappler should be able to generate my table. There is no fix yet.
Thought that by renaming there I would avoid issue.
I do have one more question. I am just applying my conditional styling, but I cannot seem to get the conditional styling to repeat for all the rows. Only the first row is updating correctly. This is my code: