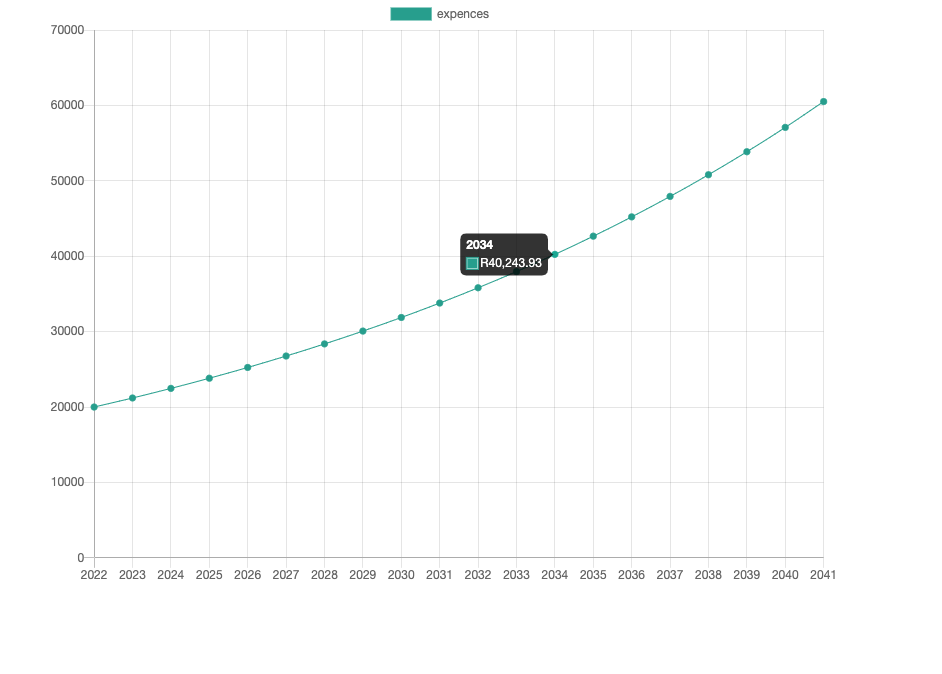
years on the x and amounts on the y, but maybe I should fist checkout the formatters in chart.js
I take it the updated file is already includedin current Wappler version?
I tried applying formatting and graph stopped displaying previously.
years on the x and amounts on the y, but maybe I should fist checkout the formatters in chart.js
I take it the updated file is already includedin current Wappler version?
I tried applying formatting and graph stopped displaying previously.
yes.
Great stuff - missed this when I searched the forum for charts posts.
Is there a way to format the values on the x or y axiz? To add currency formatting there as wel? Or just number formatting at least?
Here’s an updated version of the charts component which allows formatting for the axis labels.
dmxCharts.zip (2.5 KB)
label-x and label-y properties have been added, so you can use them like
label-y="$value.formatCurrency('$', '.', ',', 2)"
I just peed my pants a little from excitement! Thanks so much!
This has been added to the charts component in Wappler 4.4.0
This topic was automatically closed after 46 hours. New replies are no longer allowed.