Using a Google Map with an overlay showing boundaries and interact with it

Hi everyone.

I’ve been asked to put a Google Map onto a webpage which has an overlay showing county regions. When a region is selected on the page (could be a button or select dropdown) or they click on the actual map, we filter the data so relevant information is shown.

See this as an example:

I can create the map in Google Maps, I can import the KML file to provide all the boundaries but I don’t know how to interact with it when embedded on the page.

Has anyone got experience with this?

I’m wondering if this is a better way of doing it?

I think what you are describing is drawing on top of your map, kinda like this:

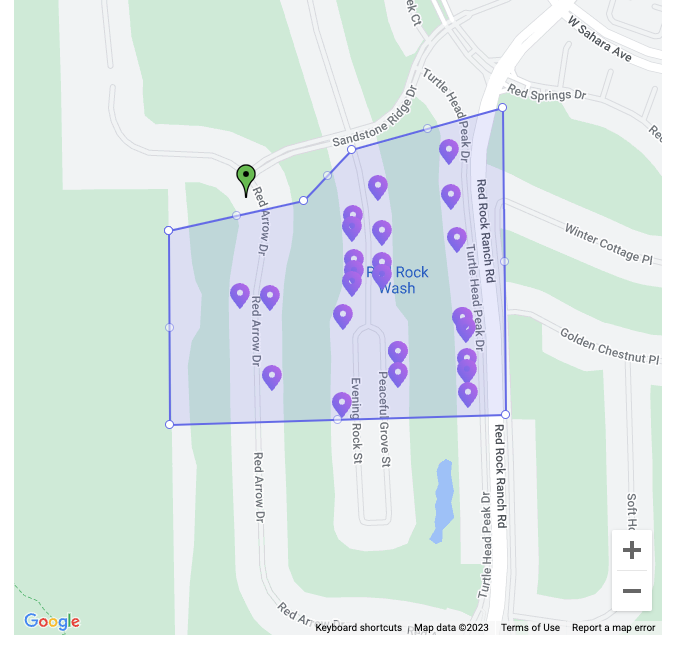
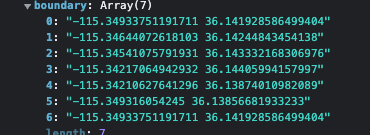
In my use case, I store the boundary points to create freeform regions:

Screenshot 2023-01-20 at 9.09.40 AM

But I would think you could just as easily store the boundary of a county and use that.

You add the drawing library to your script:

  <script src="https://maps.googleapis.com/maps/api/js?key=AIzaSyREDACTeS3Y&amp;libraries=places,drawing"></script>

Then create js functions to handle the display of your region and attach it to the wappler map element.

Here is the thread that got me started:

1 Like

Thanks for this, @mebeingken.

I’m leaning away from actual maps and using SVG files instead. I don’t actually need any map data, I can just create the vectors and use them on the page.

If I were to do something like this:
https://staceymck.medium.com/making-an-interactive-svg-map-with-oo-javascript-2c5abc73481c

Is it easy to work with the JS variables in Wappler?

I agree that SVG maps is the way to go. I had built a site 7/8 years ago before there was a Wappler using Dreamweaver and DMX plugins and I used a SVG map with clickable regions without too much trouble.

Unfortunately the site has been updated and that section is not there anymore.

This is a good starting point to get some maps: https://codecanyon.net/search/svg%20map

1 Like