
I created both a database query and a custom query. For the custom query there is a schema that is generated.
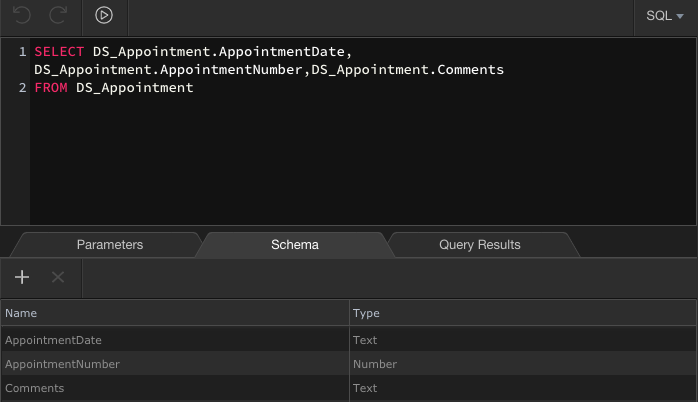
When you type it out manually in code, it works. like {{serverconnect1.data.query1[0].LocationName}}. So is this a bug? It pulls the data correctly when you enter it manually, it just doesn’t show the data tree.
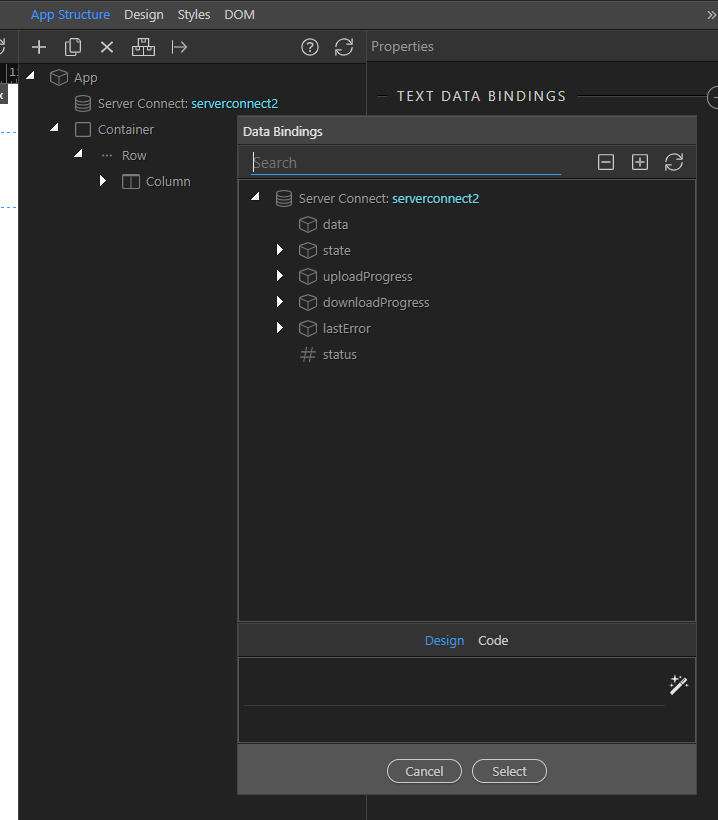
Yes doing this manually works but it does not appear in the Data Bindings window.
Why are you using custom query for such a simple query? You can do this in the Query Builder easily.
Please test using a regular query and check if the data picker shows the data.
I have been working with @TerryD on this project. We did try a simple query first. When that didn’t work, we then tried a custom query.
Just wanted to add this. The reason it is such a simple query is because the first one we did didn’t work, so we went back to the basics. When the query builder query didn’t work, we tried the custom query, same result.
Our issue is a little different from the other like this in the fact that the Server Action works, and in the page you can just manually add the code and the binding works, you just can;t see the schema in the app structure tree.
So it’'s not working for both query builder and custom query? What about other server actions?
Correct, does not show up in either one. We have tried multiple server actions, querying different tables, etc. Same result. No schema but you can manually add it in the page and it works - Just still does not add it to the schema though. We are doing the same thing we’ve done for the past 2 years with the other server models, just this time around it is with Node.JS on a Windows Server.
Ah so it’s NodeJS then, it’s good to note this when posting the bug report.
Can you show a screenshot of what’s included in your server action? Also - what do you see when you run it in your browser?
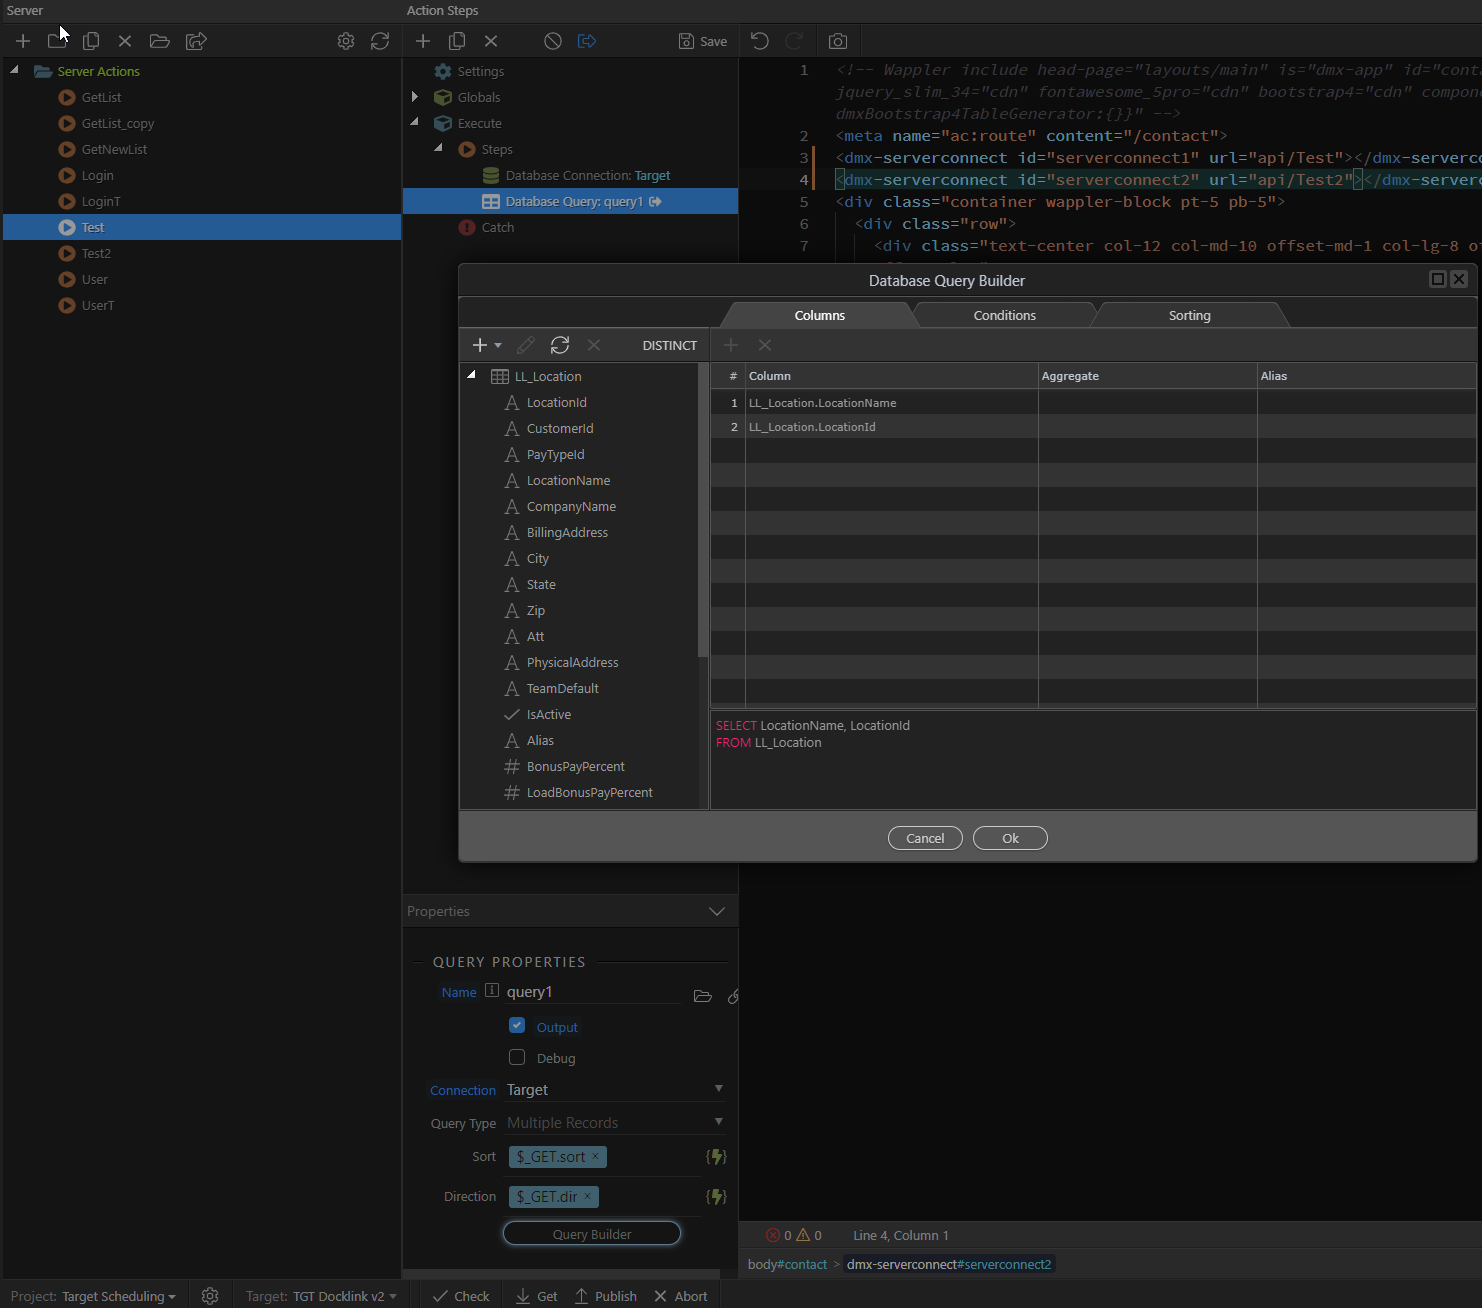
Sure. @TerryD posted some pics earlier in the post but I will post some more. It’s just a simple query. Here is the Server Action showing the query:
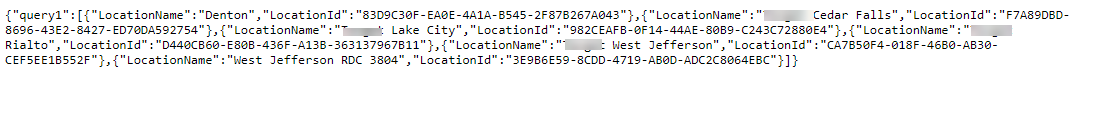
And the result when you view that Server Action in the browser: ( I had to blur out the customer’s name)
Everything is good so far. Over on the Server Connect side, a simple Server action:
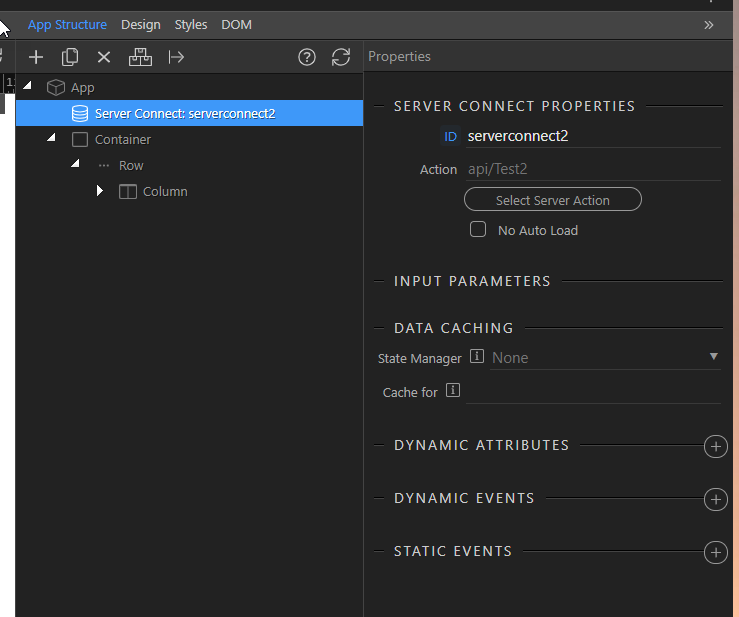
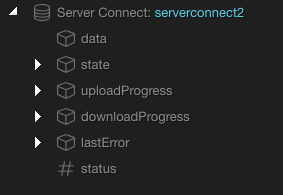
But when I try to add the bindings, there is no schema:
I can add the code on the page manually and it works:
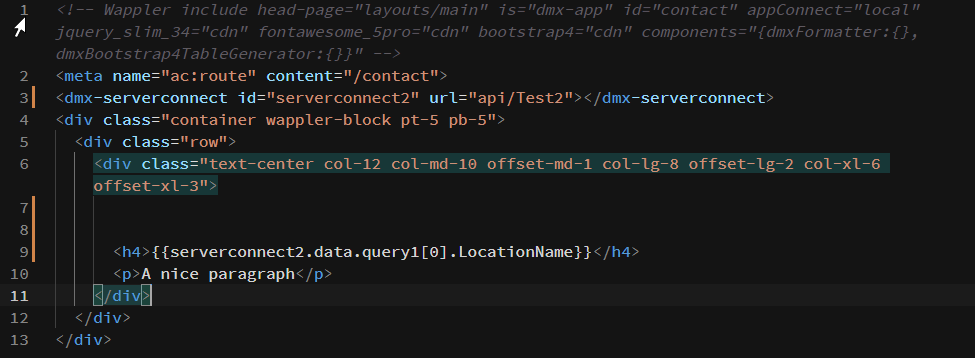
However it does not change the schema in the data bindings.
I thought @TerryD stated it was node, but I guess he didn’t. Also, I have Windows, he is on a Mac and we get the same result.
I couldn’t really replicate the problem. Tried creating all kind of server actions and their data is immediately available for picking.
Maybe try to save the server action again and if that doesn’t help post its code here. You can use the “open in editor” on the server action context menu.
We have saved it too many times to count, and tried from different tables, different queries, etc. It’s entirely possible we are doing something wrong on our server end, because we are serving this on our own Windows server with IIS. However, the Server action file works, all other pages work, it’s just the schema in the App connect. Here’s the Server Action:
{
  "meta": {
    "$_GET": [
      {
        "type": "text",
        "name": "sort"
      },
      {
        "type": "text",
        "name": "dir"
      }
    ]
  },
  "exec": {
    "steps": [
      "connections/Target",
      {
        "name": "query1",
        "module": "dbconnector",
        "action": "select",
        "options": {
          "connection": "Target",
          "sql": {
            "type": "SELECT",
            "columns": [
              {
                "table": "LL_Location",
                "column": "LocationName"
              },
              {
                "table": "LL_Location",
                "column": "LocationId"
              }
            ],
            "table": {
              "name": "LL_Location"
            },
            "joins": [],
            "query": "SELECT LocationName, LocationId\nFROM LL_Location",
            "params": []
          }
        },
        "output": true,
        "meta": [
          {
            "name": "LocationName",
            "type": "text"
          },
          {
            "name": "LocationId",
            "type": "text"
          }
        ],
        "outputType": "array"
      }
    ]
  }
}
And here is the url for the server action:
http://tgtv2.docklink.net/api/Test
When we go back to our other projects that are .net server model, everything works just like that always have. The only other time I’ve seen this happen is when the Server Action file is not saved or has something corrupt but it’s saved and working. Since this is our first Node.JS project, maybe we are doing something wrong on the project setup or something, but strange that it is only affecting the schema in the data bindings.
This is kind of a long shot, but I’ve had things like this happen to me before.
Have you refreshed the action scripts? I will save the script I am on and then refresh. But sometimes I have to refresh, switch to another script and then switch back and then the schema will be there. Kind of like it doesn’t completely refresh correctly?
It’s a good idea, but we’ve done that. Even so far as create a new page, new Server Action, etc. I have had issues like this come up when doing this with classic asp and asp.net, but a re-save, refresh or reload the page made it work. No such luck here. Thanks for the input.
It this just the one server action that doesn’t work or any server action?
Try creating a new one.
Server model is still NodeJS right?
Server model it still Node,js. Yes, it is with all server actions for us, using Node.js. Any server action, any database, any table, custom query or basic query. same result. No schema.
Well there must be something general wrong in your project. Maybe try to create a new one from scratch.
If problem persist, restart Wappler with logging, reproduce the problem and attach the debug log. See:
This is fixed in Wappler 3.3.6
This topic was automatically closed after 46 hours. New replies are no longer allowed.