Thanks @Max_Saravia, yes the charts.js don’t seem to match the range of visualisations that you get with apex charts. I should invest some time to digest them as a gauge chart would be useful.
1 Like
Hi @Max_Saravia,
Thanks for your response and tip on using Apex Charts. Could you perhaps help me out by explaining for a bit how you use Apex Charts with Wappler?
I’ve tried using charts.js by adding this to the html:
“<“canvas id=“myChart”>”<”/canvas> (added " to be able to use the code on this post, not in original html)
And then I add a script to the bottom of the page rending some simple graph:
"<"script>
function my_script(){
    console.log(dmx.parse('{{api1.data.verkocht}}'));
var value = 75;
var data = {
labels: [
“My val”,
“”
],
datasets: [
{
data: [value, 100-value],
backgroundColor: [
“#FF6384”,
“#AAAAAA”
],
hoverBackgroundColor: [
“#FF6384”,
“#AAAAAA”
],
hoverBorderColor: [
“#FF6384”,
“#ffffff”
]
}]
};var myChart = new Chart(document.getElementById(‘myChart’), {
type: ‘doughnut’,
data: data,
options: {
responsive: true,
legend: {
display: false
},
cutoutPercentage: 60,
tooltips: {
filter: function(item, data) {
var label = data.labels[item.index];
if (label) return item;
}
}
}
});textCenter(value);
function textCenter(val) {
Chart.pluginService.register({
beforeDraw: function(chart) {
var width = chart.chart.width,
height = chart.chart.height,
ctx = chart.chart.ctx;ctx.restore(); var fontSize = (height / 114).toFixed(2); ctx.font = fontSize + "em sans-serif"; ctx.textBaseline = "middle"; var text = val+"%", textX = Math.round((width - ctx.measureText(text).width) / 2), textY = height / 2; ctx.fillText(text, textX, textY); ctx.save(); }});
}
}
“<”/script>
This works great a creates a nice pie chart. However, I don’t understand how to use my serverconnect or api data for these charts. As soon as I add for instance “{{api1.data.some_value}}” the chart doesn’t work anymore. Would you be able to share how you do this with Apex Charts? It would be awesome if you could share one example where you use your serverconnect or api data together with Apex Charts. I would be very grateful! 
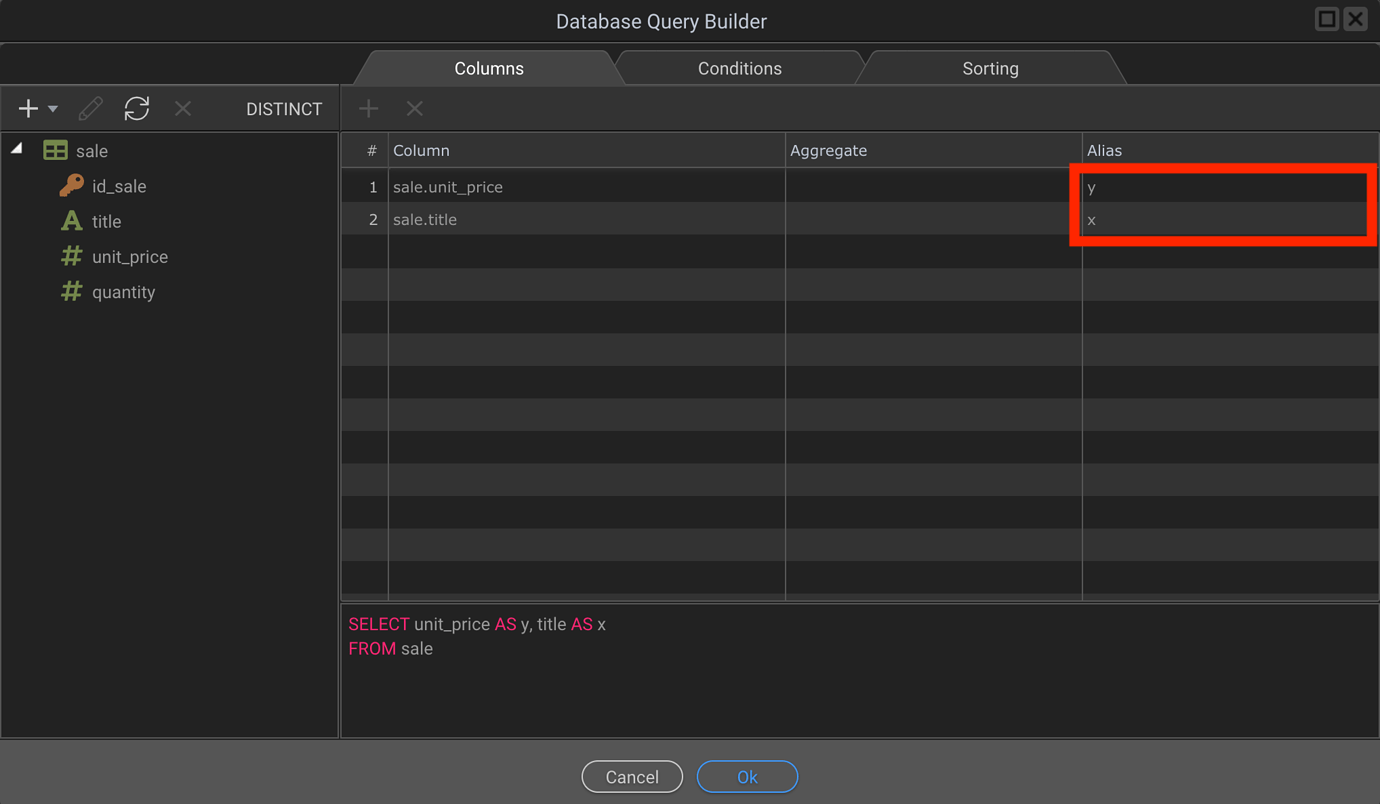
Hi @jellederijke sure no problem, the first thing you have to do is create a server action that returns the two variables that your chart will use in this way:
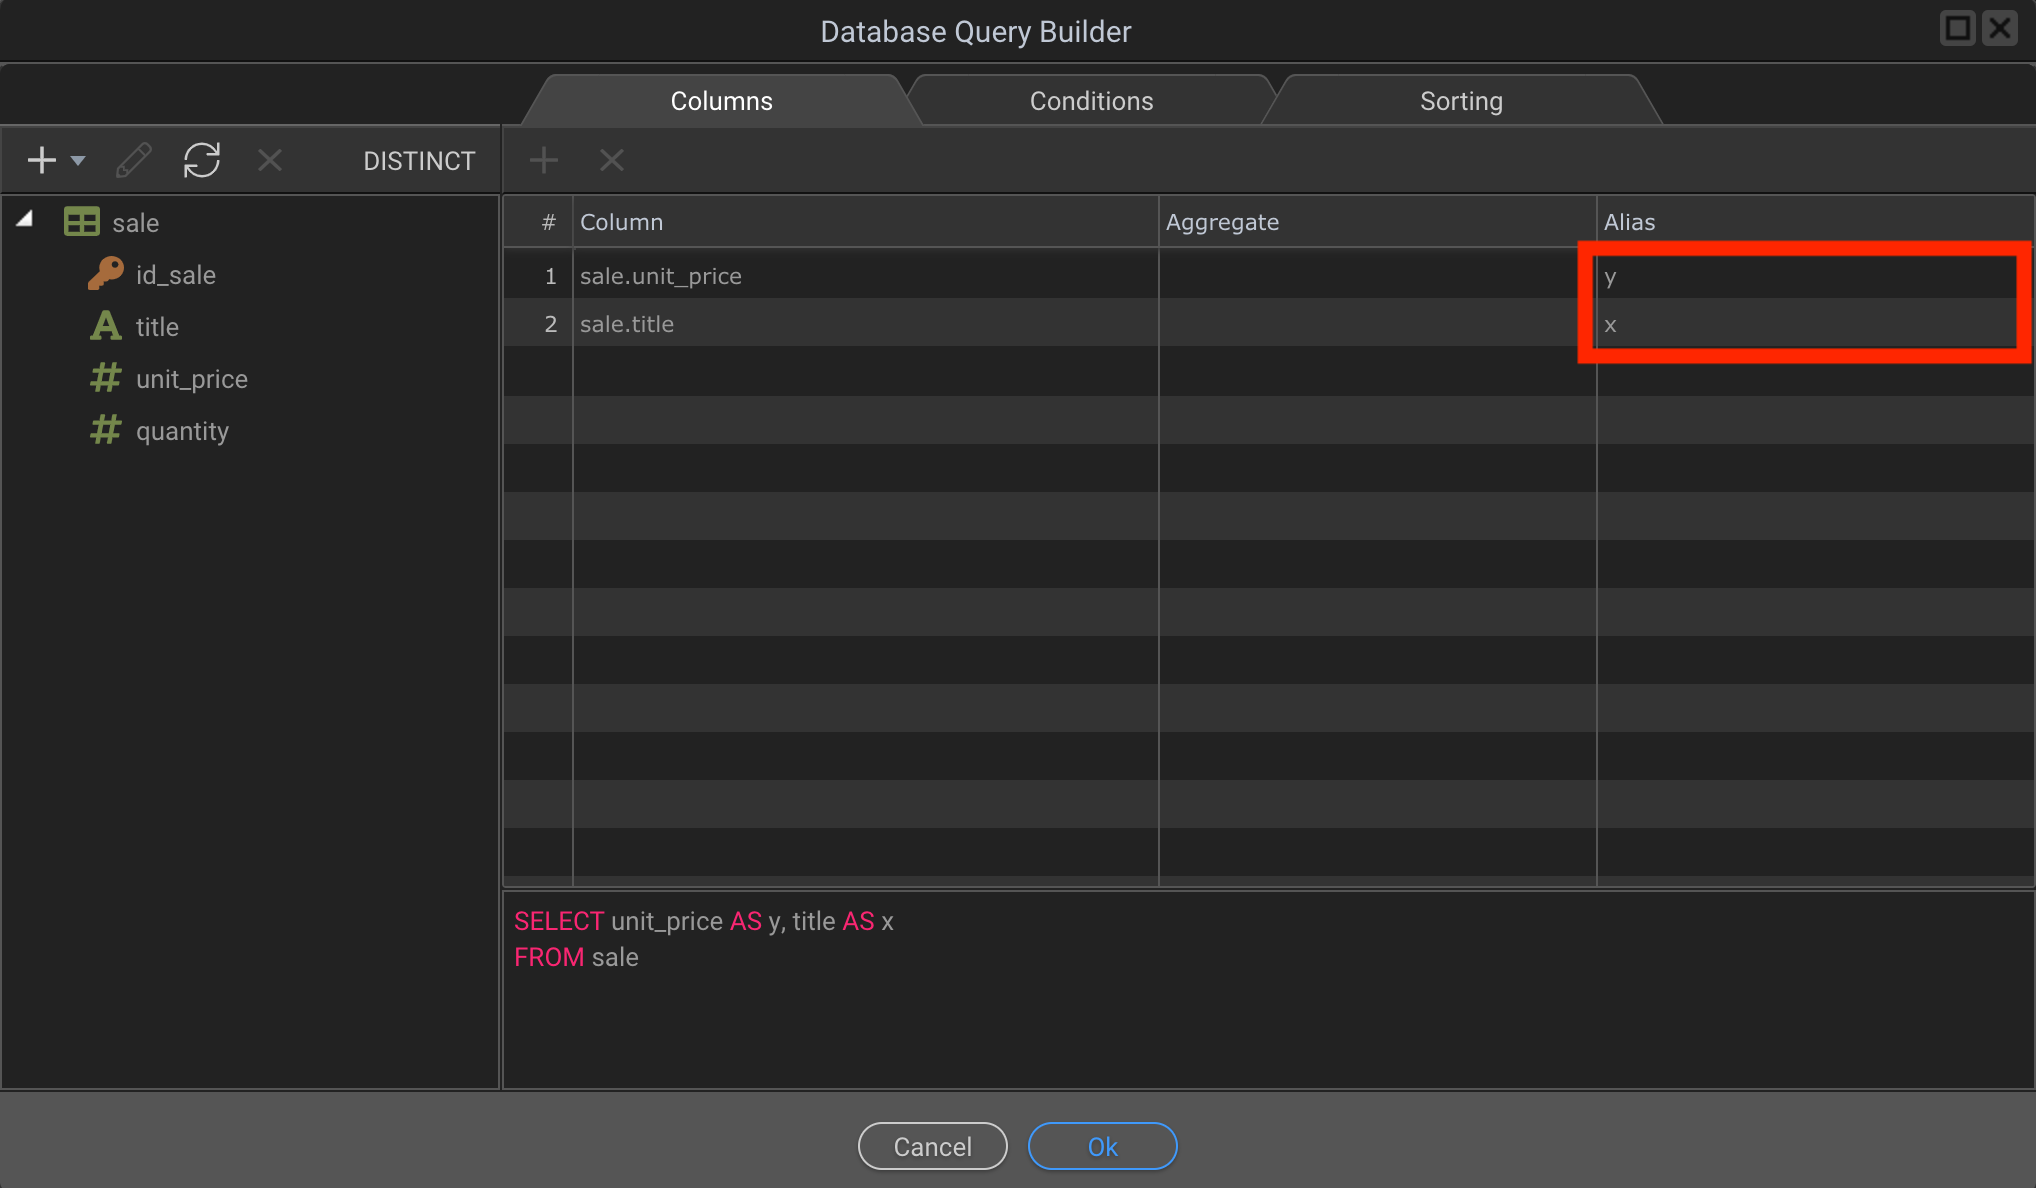
It is very important that you write as aliases to your two variables x and y because this way the script will be able to read which values of the array go on which axis.
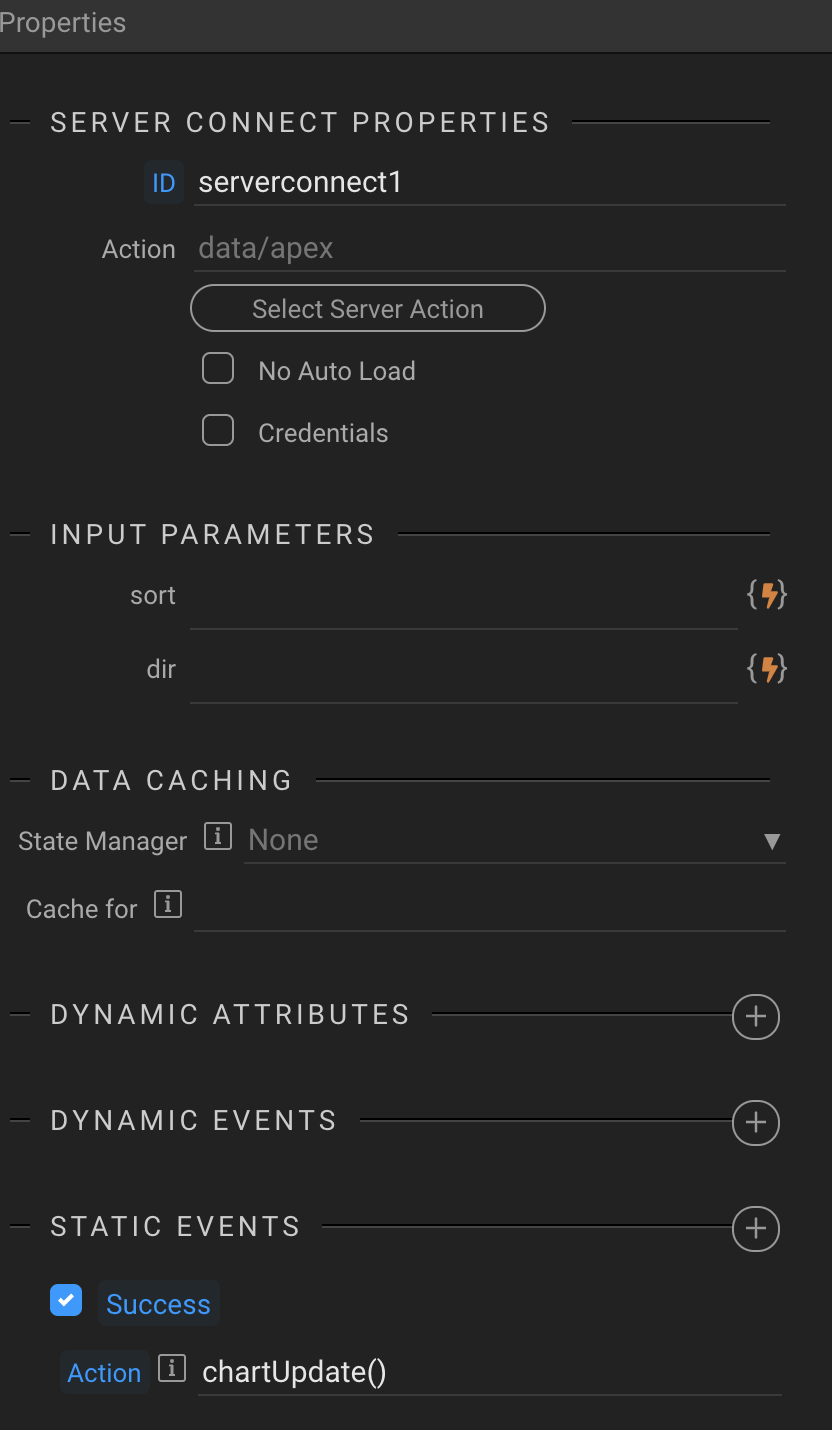
Then in the frontend you create a serverconnect that calls the action before created:
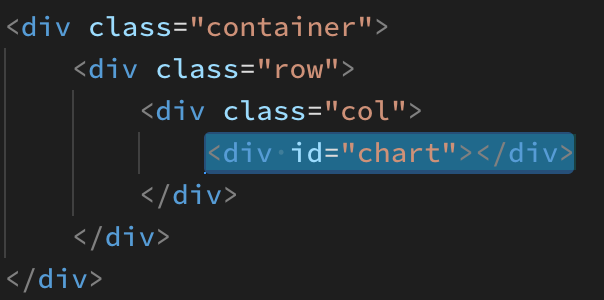
Then you create a div and give it the name you want, later you must add this name in the script of your chart.
Then you can add the script that I put below inside your page or create a new js file and include it.
	<script>
		var options = {
  chart: {
	 locales: [{
      "name": "es",
      "options": {
        "toolbar": {
            "exportToSVG": "Descarga SVG",
            "exportToPNG": "Descarga PNG",
			"exportToCSV": "Descarga CSV",
            "menu": "Menu",
            "selection": "Selección",
            "selectionZoom": "Selección Zoom",
            "zoomIn": "Acercar",
            "zoomOut": "Alejar",
            "pan": "Mover",
            "reset": "Resetear zoom"
        }
      }
    }],
    defaultLocale: "es",
      height: 350,
      type: 'line',
  },
  dataLabels: {
      enabled: false
  },
  series: [],
  title: {
      text: 'Apex Chart Test',
  },
  noData: {
    text: 'Loading...'
  }
}

var chart = new ApexCharts(
  document.querySelector("#chart"),
  options
);

chart.render();

function chartUpdate() {
    chart.updateSeries(
        [{
            name: 'Cost',
            data: dmx.parse('serverconnect1.data.query1')
        }]
    )
};

	</script>
Of course you can put the buttons you want above and change the names, for example to export in svg, png, etc., mine is in Spanish. It’s all in the documentation.
The most important part of the code is here, because it is where you pass the array of values that you bring from your database, api or whatever you are using.
var chart = new ApexCharts(
  document.querySelector("#chart"),
  options
);

chart.render();

function chartUpdate() {
    chart.updateSeries(
        [{
            name: 'Cost',
            data: dmx.parse('serverconnect1.data.query1')
        }]
    )
};
Finally it is very important that you load this script after the data has been uploaded to your site otherwise the chart will not work.
You can call the function in several ways, for example when a button is pressed, but it is best to do it from the serverconnect that you created since in this way every time you load the graph it will be rendered again with the updated values.
To achieve this you just create a static event and call the created function, in this case it is chartUpdate ()

And that would be it, you can change the type of chart simply by changing the name in the variable “type” and the shape of the curve adding for example:
stroke: {
   curve: 'smooth',
},
Grabación de pantalla 2021-07-07 a la(s) 00.00.09
3 Likes
I think it would be better to cut this topic and create a new one that says something like “How to use Apex charts with Wappler” for future reference. What do you think @George or @Teodor.
2 Likes
Thank you so much, @Max_Saravia for this very elaborate explanation. I was trying it for about 15 minutes and wondering why the charts didn’t show up as in your example. Then I finally realized I hadn’t included the apexcharts library by adding this to the page:
"<"script src="https://cdn.jsdelivr.net/npm/apexcharts">"<"/script>"
(the " are added only here, otherwise it doesn’t work in this board, do not add them in app )
Everything is working now, you made me very happy! 
1 Like
1 Like
Thank you!
I’ve followed this by the book and cannot get any chart to show data.
I get the chart block, but no line.
Can anyone see anything glaringly obvious?
Error Message: It is a possibility that you may have not included ‘data’ property in series
My page is broken down as below
<dmx-serverconnect id="serverconnect1" url="api/myQuery" onsuccess="chartUpdate()"></dmx-serverconnect>

<div class="container mt-5" id="ApexChartsBlock">
    <div class="row">
        <div class="col">
            <div id="chart"></div>
        </div>
    </div>
</div>

<script src="js/chart1.js"></script>
my chart1.js is as follows
var options = {
    chart: {
        height: 350,
        type: 'line',
    },
    dataLabels: {
        enabled: false
    },
    series: [],
    title: {
        text: 'Apex Chart Test',
    },
    noData: {
        text: 'Loading...'
    }
}

var chart = new ApexCharts(
    document.querySelector("#chart"),
    options
);

chart.render();

function chartUpdate() {
    chart.updateSeries(
        [{
            name: 'Cost',
            data: dmx.parse('serverconnect1.data.query1')
        }]
    )
};
and my serverconnect1 returns the following:
{"query1":[{"x":"DEMO1","y":105},{"x":"DEMO2,"y":100},{"x":"DEMO3","y":90},{"x":"DEMO4r","y":105},{"x":"DEMO1","y":107},{"x":"DEMO3","y":85},{"x":"DEMO1","y":12},{"x":"DEMO2","y":58},{"x":"DEMO2","y":88},{"x":"DEMO4","y":96}]}
Result
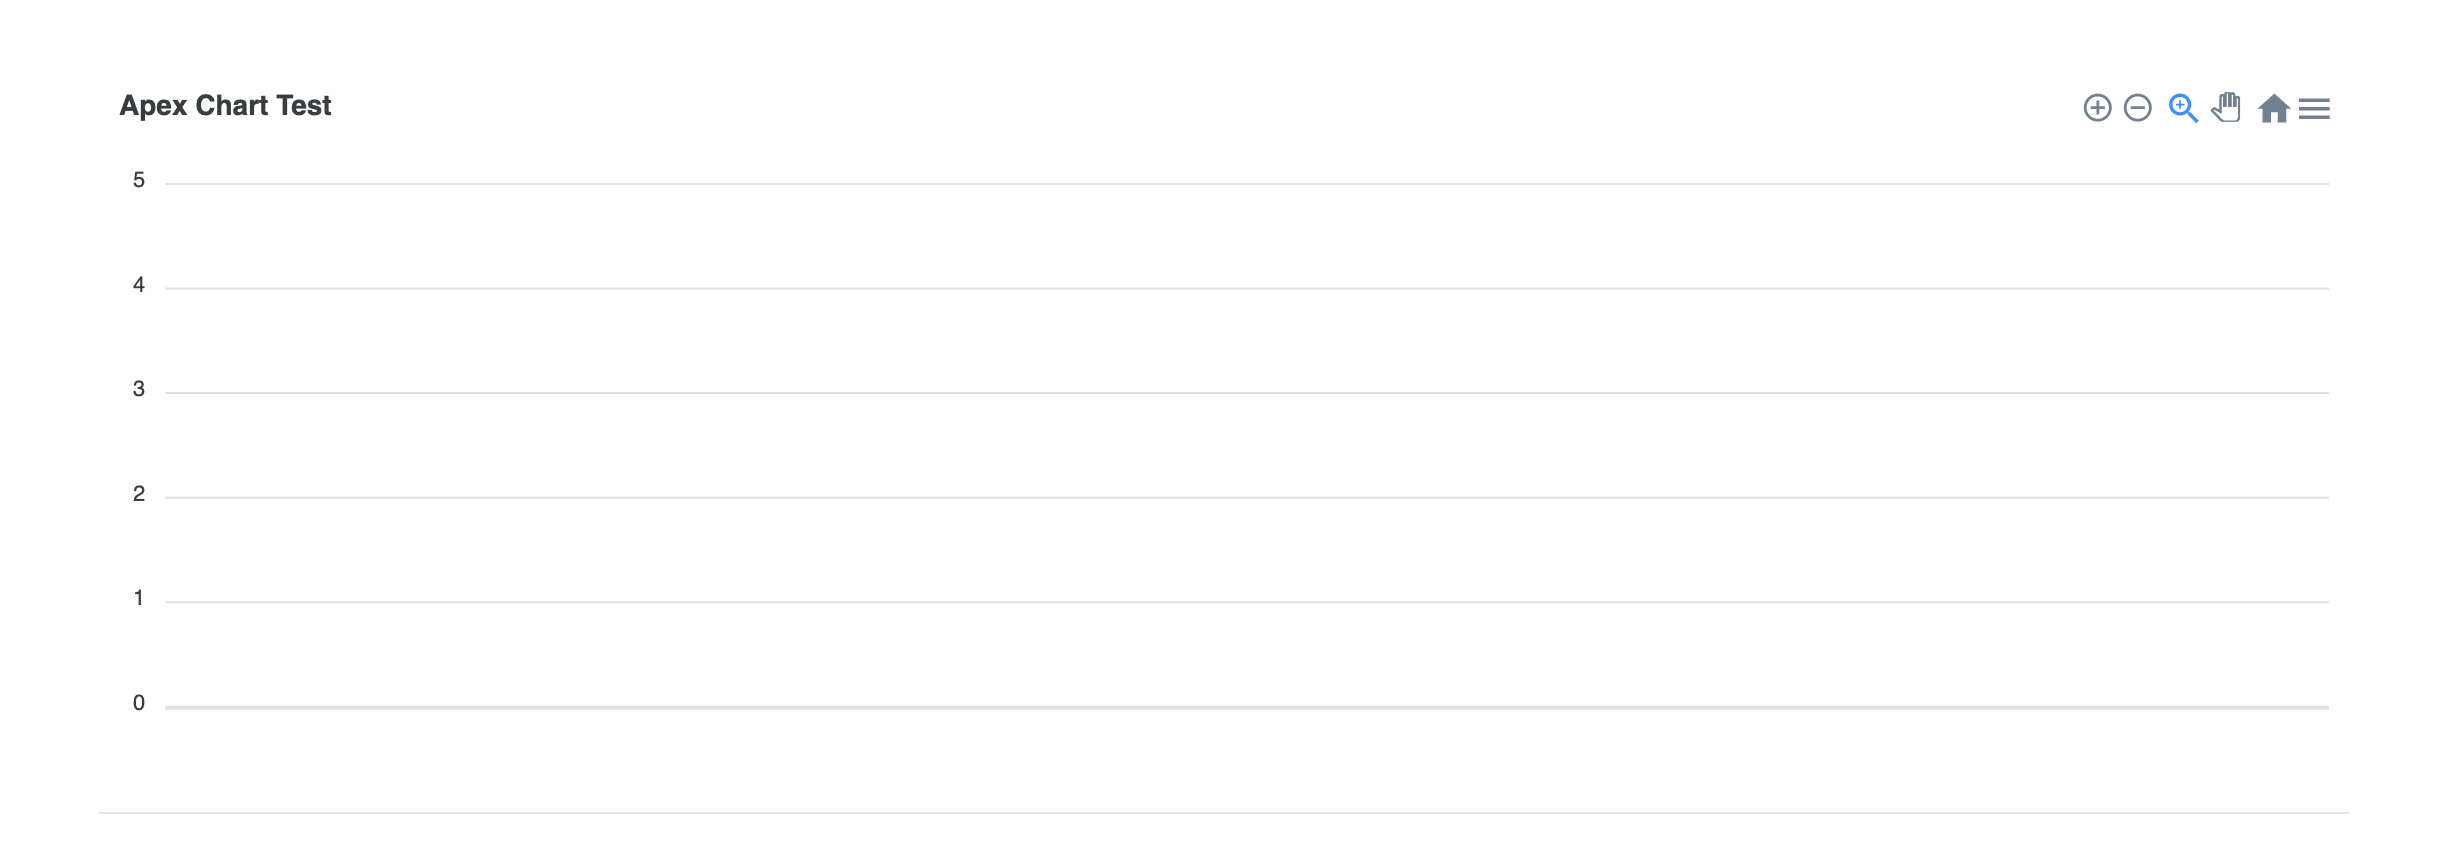
Thanks in advance
is the chartUpdate function called using the success event of the Server Connect action?
Are u working in PHP or NODE? cause if u are working with php your server connect URL should be
url="dmxConnect/api/myQuery"
As far as I can see the script is correct and you have correctly set in server connect onsuccess = “chartUpdate ()”
So the problem must be that the data from your database does not reach your page. To test that I would generate a table and see if it returns the values correctly.
Hi @Max_Saravia its NODE and that URL was correct no dmxconnect needed.
I created a table with a repeat and data was listed as expected.
I managed to resolve this, but I don’t know the reason.
The chart was initially created as a content page.
When I recreated with a normal page structure it worked.
Probably due to a timing issue.
This approach is OK for simple things, but when you get into complex javascript binding events and firing them you will end with quite some spaghetti code trying to make your vanilla js work in harmony with App Connect library. So I stopped recommending this approach for 3rd party libraries.
Now I recommend creating custom wappler components that leverage App Connect framework.
Here you have additional info on how to create one:
And if you are looking specifically for ApexCharts here you have a quick example I created a month ago:
It’s basic but it will get you going. Since then I improved my ApexCharts custom component and I’m just waiting for the team to release custom component UI support in order to release it as an extension.
Even if you are not comfortable with JS and how App Connect works I advise you to go this route because you will get a reliable and smoother experience and less “I managed to resolve this, but I don’t know the reason.”
Good luck.
Thanks for the detailed write up @Max_Saravia. I was able to get ApexCharts working. In my haste to build a quick POC I learned (after too long debugging) that dmx.parse will not work if the serverconnect is on the content page. After adding the serverconnect to the layout things worked as expected. Hopefully this saves someone time in the future!
Hey Frank,
dmx.parse should still work but you usually need to prefix it with content.
e.g.
dmx.parse("serverconnect1.data.test")
on a content page would be
dmx.parse("content.serverconnect1.data.test")
Something that I use all the time to check data references is dmx.app.data
You can check the full path to and dmx data item on the page.
1 Like
That is super-helpful. Thank you!
1 Like
Hi Max_Saravia,
Thank you so much for your help. Beautifully explained and that’s why first time I tried it, and it worked. I do though want to know if I want to have a trend type apex chart, let’s say 7 days trend for {{serverconnect3.data.cpuload.value}} datapoint. This data point is coming stright from an opc ua server device. I can bring the point in, and I can read it all fine on any element using dynamic attribute, but how can I insert 7 days every 5 minutes of it in the apexchart? using dmx.parse(‘serverconnect3.data.cpuload.value’) is not working! any help would appreciated so much.
Ashur…
Hi Ashur, sorry for the delay in the response, I was traveling and quite disconnected. I’m glad my explanation was helpful to you.
Regarding your question, exactly how do you get that data? from a sql database, a json file, or some other way? On the other hand, did you set the Aliases correctly in the server-side query?
No worries Max. Thanks a lot for your response.
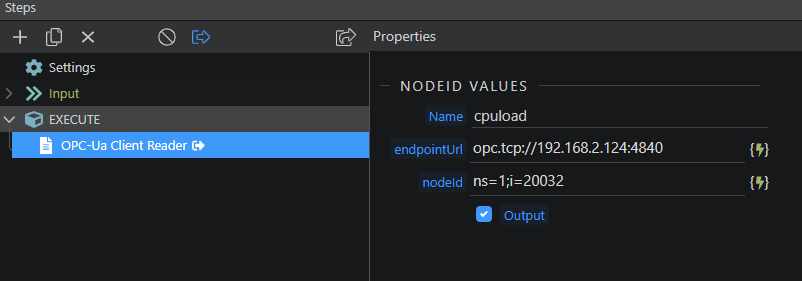
So there is an opc ua extension where you can use to bring in your data from an opc ua devices. the extension is made by sw11, and this link shows how you install it https://watch.screencastify.com/v/DNaA62ZIJco7KGFP8qTJ
so that’s my plan on how to bring the data in. but I’m not sure if it’s the best way compare to other ways like MySQL database. Please check it out and let me know your thoughts. It’s interesting extension
Best regards.
So did u set the aliases x and y so the script can read the data for the correct axis and display it?
like i did here:
Of corse u gonna have to do it inside your code extension.
so this extension goes straight to the data. there is no query type connection. it connects Like this,
So I can connect to to it using {{SC.data.cpuload.value}} through dynamic attribute, but when I put that in data: dmx.parse(‘SC.data.cpuload.value’) it doesn’t work because how can I say that y or x! like in your query image, that’s one issue . The other thing Max. let’s say I use database query like you way, when I have 3 Ys and one X how do you do that in the query?