Coindesk API help

Hi,

I’m trying to apply myself to API and trying to get working the API of Coindesk for Bitcoin quotes.

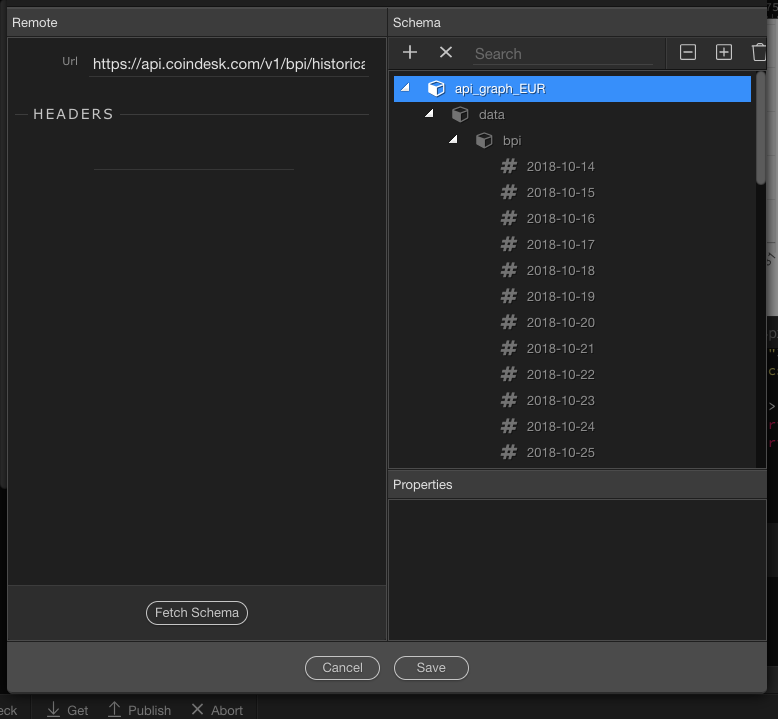
I m trying to use the API for historical values:

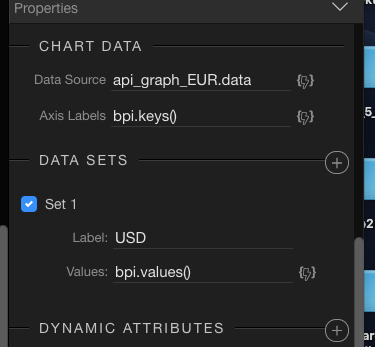
and create a chart with these values

Here come the problems:

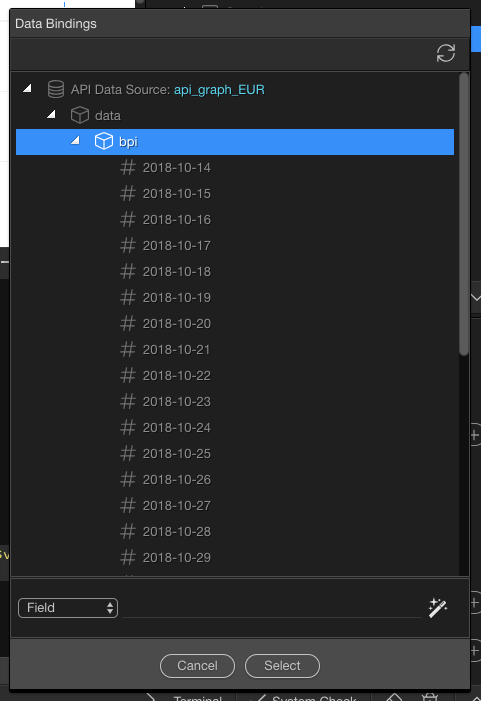
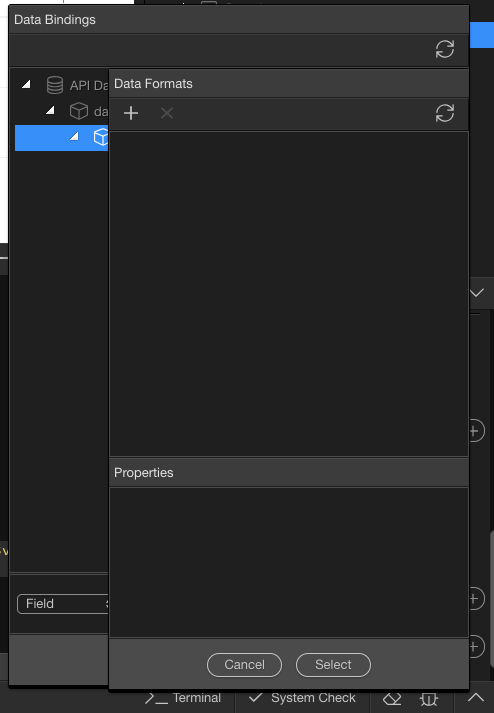
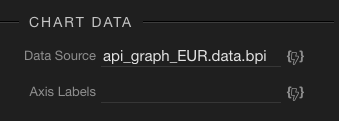
In the API schema, I have only a list of dates (i m supposing each date contains the value of this day)

But How can I bind these value to Chart?
and how bind the axis?

03

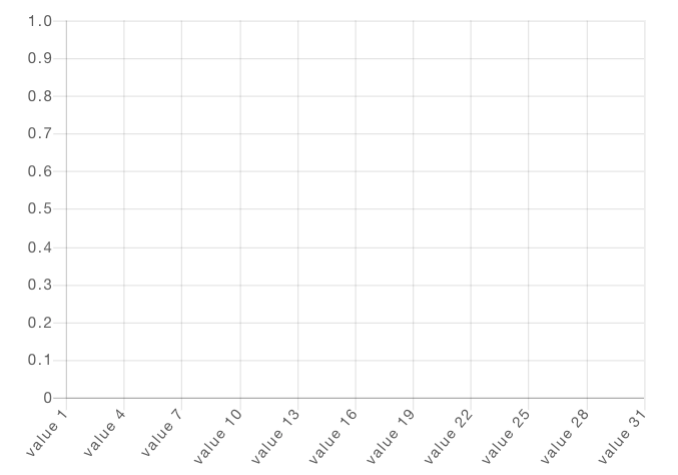
In this way I got only an empty graph

44

API description is at: https://www.coindesk.com/api
Thank you very much for your help

Roberto

Enter $key as Axis Lables

and $value as Data Set 1 values

like that ?

03

No just as I typed $key and $value.

Those special values are also available in the data picker

and your data source was fine: api_graph_EUR.data.bpi

It works! thank you very much @George

Only one thing about the data picker:

If I set data source fine as it is, I have problems to pick the $key and the $value up in the data picker, because it do not appears:

I click on data picker:

then I open data formatter and it is empty:

for the future: how I can pick the $key and $value from data picker?

thank you in advance
Roberto

You can only choose it - after you have assigned the expression to the chart.

When you call the data picker after it - they will be available under the chart data bindings